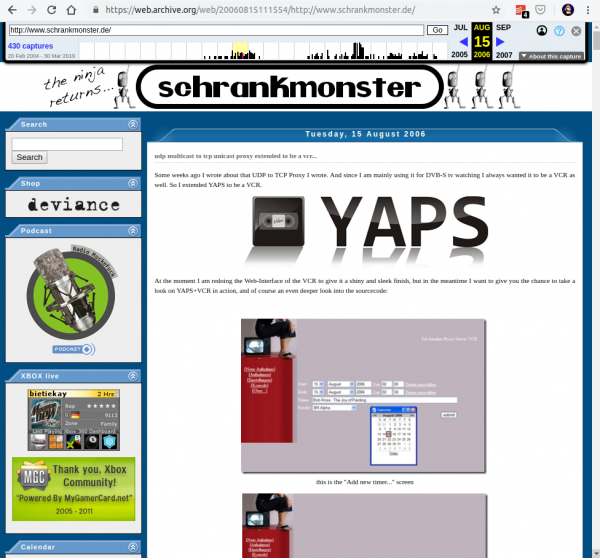
Many use and love archive.org. A service that roams the public internet and archives whatever it finds. It even creates timelines of websites so you can dive right into history.
Have a piece of history right here:
You can have something similar hosted in your own environment. There are numerous open source projects dedicated to this archival purpose. One of them is ArchiveBox.
ArchiveBox takes a list of website URLs you want to archive, and creates a local, static, browsable HTML clone of the content from those websites (it saves HTML, JS, media files, PDFs, images and more).
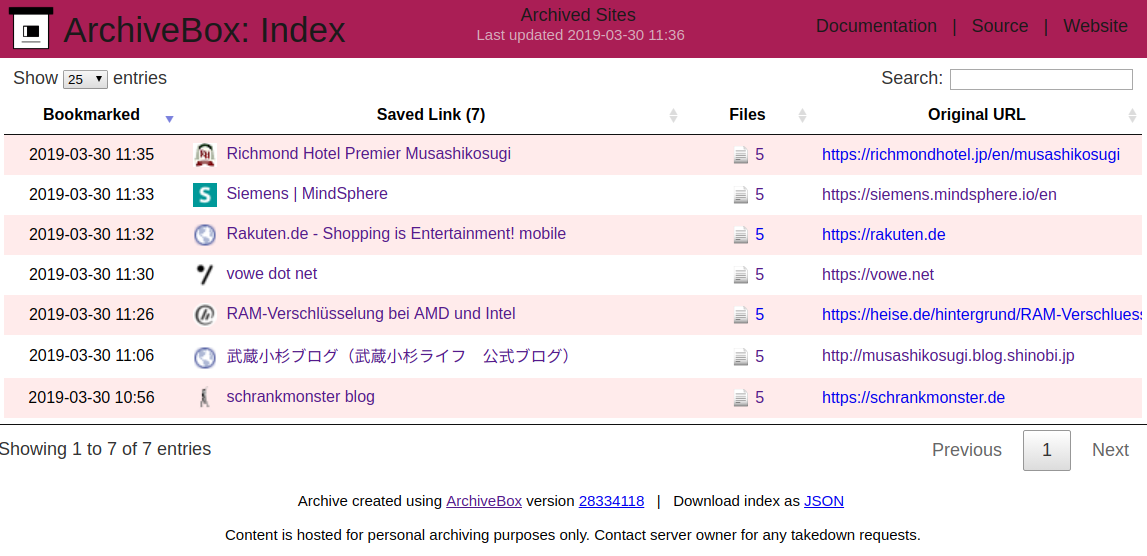
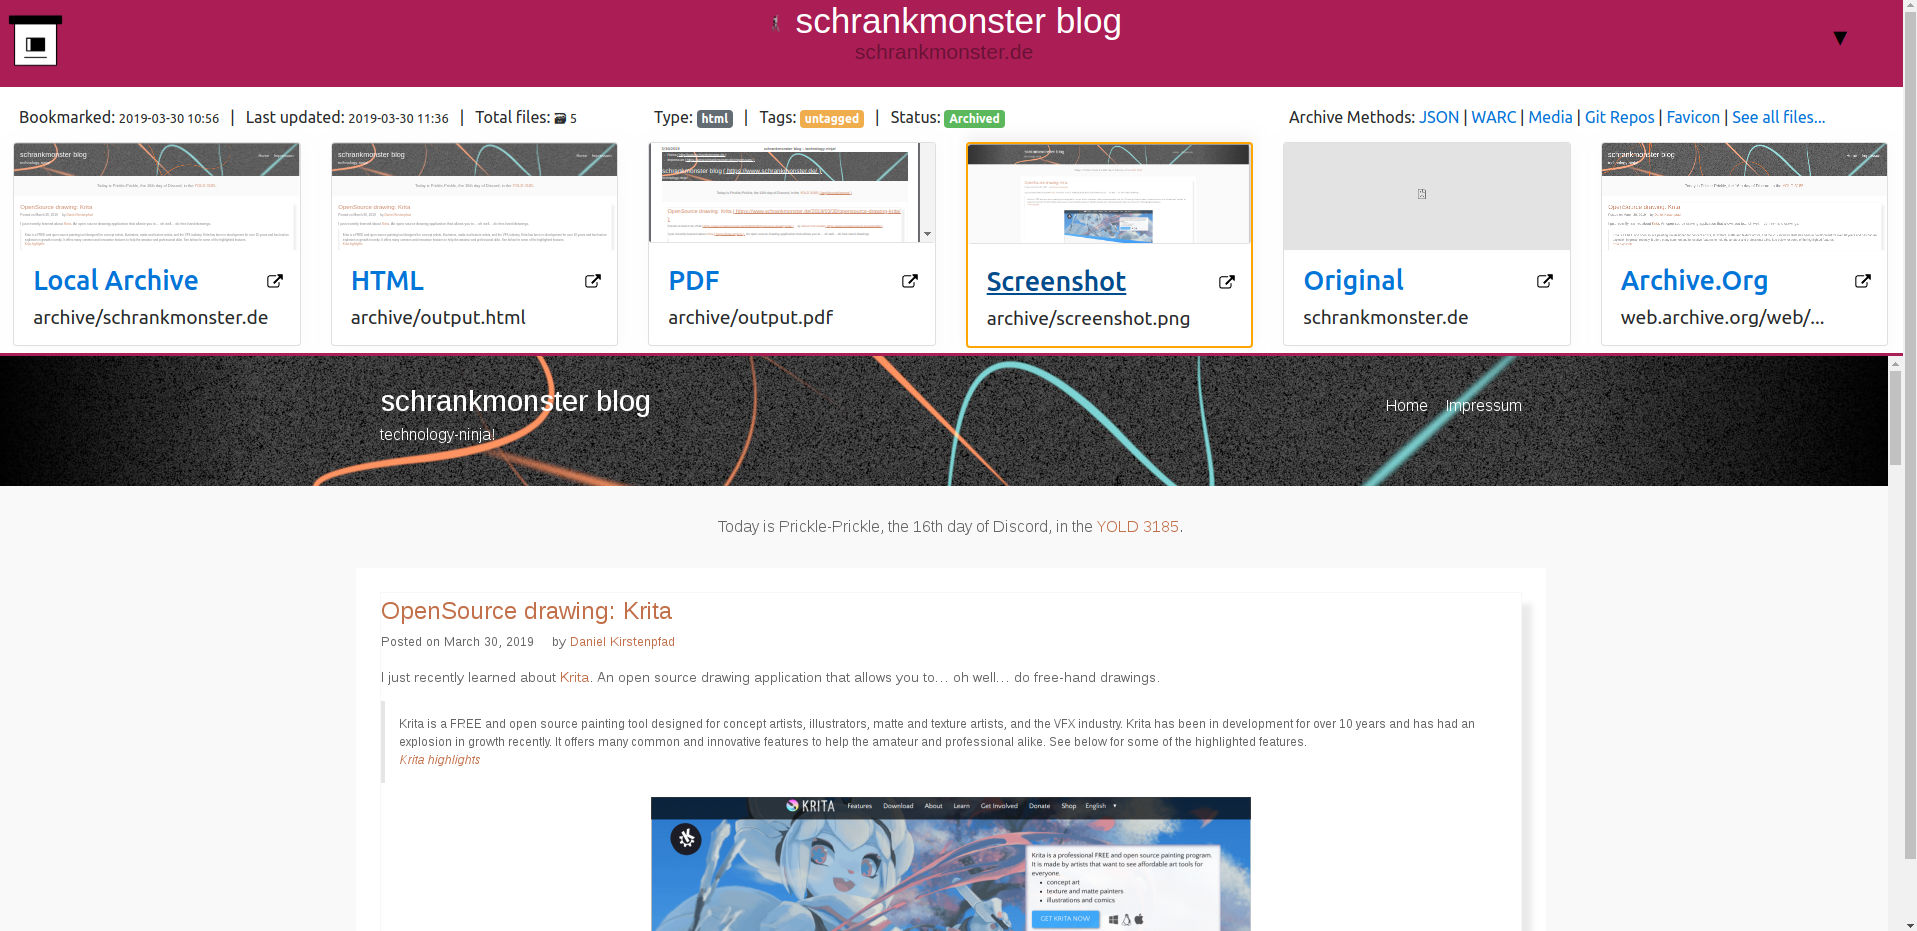
I’ve done my set-up of ArchiveBox with the provided Dockerfile. Every once in a while it will start the docker container and check my Pocket feed for any new bookmarks. If found it will then archive those bookmarks.
As the HTML as well as PDF and Screenshot is saved this is extremely useful for later look-ups and even full-text search indexing.
Poka-yoke (ポカヨケ, [poka yoke]) is a Japanese term that means “mistake-proofing” or “inadvertent error prevention“. A poka-yoke is any mechanism in any process that helps an equipment operator avoid (yokeru) mistakes (poka). Its purpose is to eliminate product defects by preventing, correcting, or drawing attention to human errors as they occur.[1] The concept was formalised, and the term adopted, by Shigeo Shingo as part of the Toyota Production System.[2][3] It was originally described as baka-yoke, but as this means “fool-proofing” (or “idiot-proofing“) the name was changed to the milder poka-yoke.
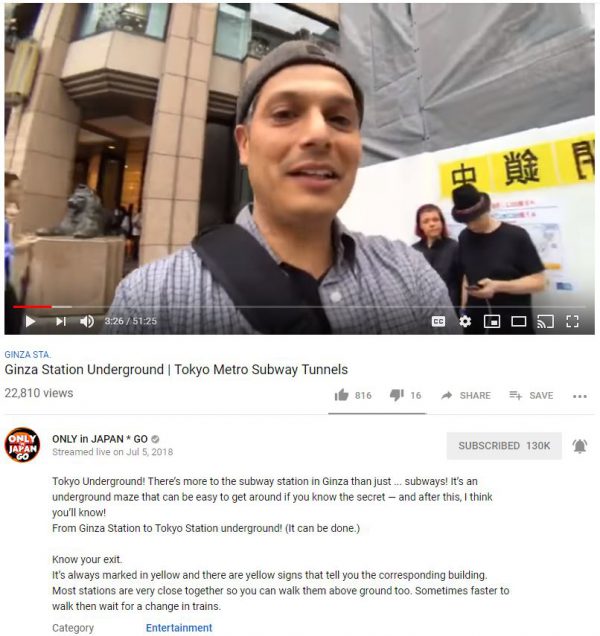
When you are searching the internet for more information and things to learn about Japan you will inevitably also find John Daub and his “Only in Japan” productions. And that is a good thing!
ONLY in JAPAN is a series produced in Tokyo by one-man band John Daub.
Back in 2018 we even where around when John announced that he is going to live-stream.
And so we met up with him and eventually even said “Hi”.
this is John in full gear
Of course it wasn’t just us who got a good picture. We were part of the live stream as well – involuntarily as we had tried very hard to not be in frame.
Have you ever asked yourself what those generations coming after us will know about what was part of our culture when we grew up? As much as computers are a part of my story a bit of gaming also is.
From games on tape to games on floppy disks to CDs to no-media game streaming it has been quite a couple of decades. And with the demise of physical media access to the actual games will become harder for those games never delivered outside of online platforms. Those platforms will die. None of them will remain forever.
Hardware platforms follow the same logic: Today it’s the new hype. Tomorrow the software from yesterday won’t be supported by hardware and/or operating systems. Everything is in constant flux.
Emulation is a great tool for many use-cases. But it probably won’t solve all challenges. Preserving access to software and the knowledge around the required dependencies is the mission of the Video Game History Foundation.
Video game preservation matters because video games matter. Games are deeply ingrained in our culture, and they’re here to stay. They generated an unprecedented $91 billion dollars in revenue in 2016. They’re being collected by the Smithsonian, the Museum of Modern Art, and the Library of Congress. They’ve inspired dozens of feature films and even more books. They’re used as a medium of personal expression, as the means for raising money for charity, as educational tools, and in therapy. And yet, despite all this, video game history is disappearing. The majority of games that have been created throughout history are no longer easily accessible to study and play. And even when we can play games, that playable code is only a part of the story.
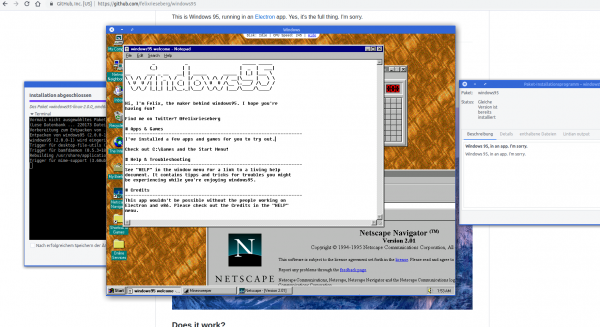
The times of Windows 95 are long gone. But some projects try to keep it alive. This project uses some system virtualization to bring you Windows 95 almost on any platform with almost no dependencies.
This is Windows 95, running in an Electron app. Yes, it’s the full thing. I’m sorry.
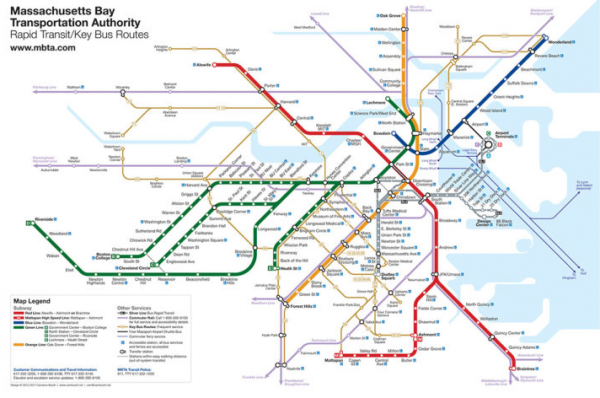
We’ve all used them. And if they are made well they really make life easier: Transit Maps.
Apart from using transit map art style to visualize a train line transit maps can be applied to a lot of data visualization needs.
Take time to consider everything about your diagram. How thick do you want the route lines to be? Are they touching, or is there a slight gap between them? Are you going to use curves or straight edges where a line changes direction? Consider your station markers – will they be ticks, dots or something else? Think about how you would like to differentiate interchange stations or transit centres as well. Consider the typeface you’re going to use for station names – it should be legible and simple. When you’ve considered all these points, you’ve given yourself a set of rules that you will use to construct the diagram. Every design decision you make should be evaluated against these rules: sometimes, you can break them if needed, but it definitely helps to have them in your head as you work.
Every major version of Mac OS X macOS has come with a new default wallpaper. As you can see, I have collected them all here. While great in their day, the early wallpapers are now quite small in the world of 5K displays. Major props to the world-class designer who does all the art of Relay FM, the mysterious @forgottentowel, for upscaling some of these for modern screens.
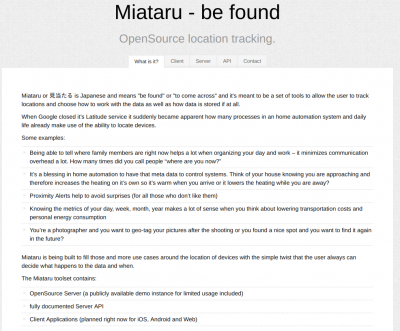
Not a lot of things are more private than your location.
Yet sometimes you wish to share your location with friends and family. May it be during an event or regularly. Maybe you want to
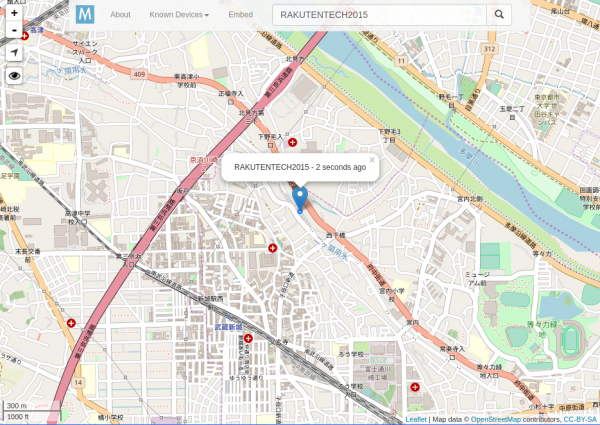
To allow the tech-minded audience to be in full control of what data is aggregated and stored regarding these needs I’ve created Miataruback in 2013 as an open-source project from end-2-end.
With the protocol being completely open and ready to be integrated into any home automation interested users can either utilize the publicly available (stores-nothing-on-disk) server or host your own.
Everything from the server to the clients is available in source and there’s a ready-to-go version of the client app on the AppStore.
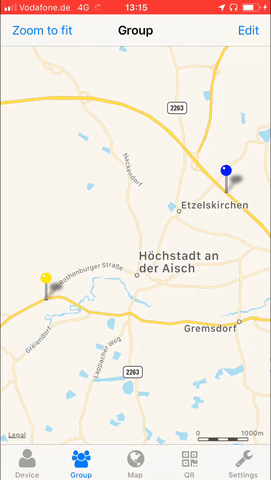
this is a location sharing session when the blue pin met the yellow pin
Antenna shops were first established in Tokyo in the early 1990s as a means for regional governments to promote local goods and products to the capital’s many residents. Antenna shops for Okinawa and Kumamoto were the first to arrive on the scene in 1994, with the current total of prefectural outlets totaling around 54 – with 28 shops dotted about the Ginza/Yurakucho area alone. Some prefectures retain only one location, while a handful of prefectures sell their goods in multiple outlets.
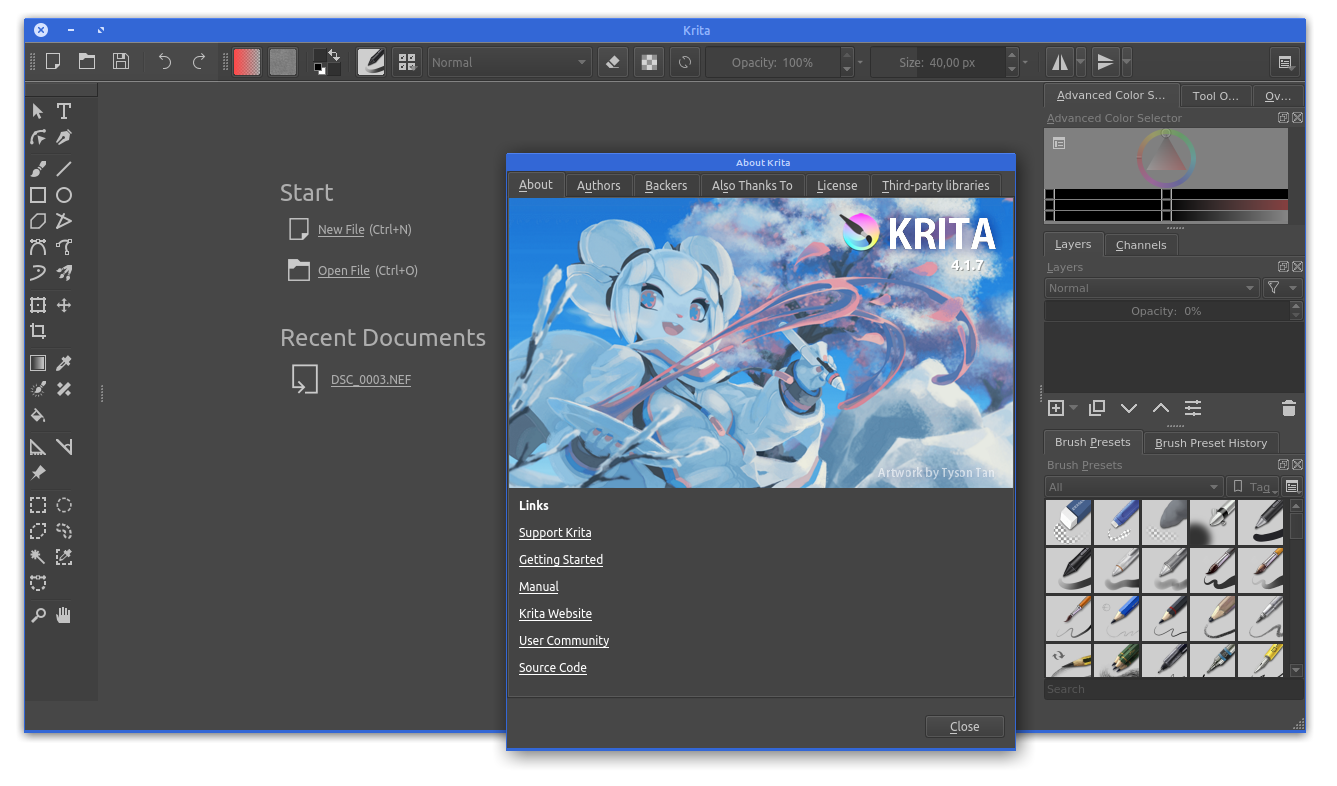
I just recently learned about Krita. An open source drawing application that allows you to… oh well… do free-hand drawings.
Krita is a FREE and open source painting tool designed for concept artists, illustrators, matte and texture artists, and the VFX industry. Krita has been in development for over 10 years and has had an explosion in growth recently. It offers many common and innovative features to help the amateur and professional alike. See below for some of the highlighted features.
About a year ago there were some very interesting reports about a german inventor and his invention: a highly futuristic, transforming smartphone airbag.
It would be attached to your phone and when you drop it, it would automatically deploy and dampen the impact.
Like so:
Impressive, right? There’s now a Kickstarter campaign behind this to deliver it as a product. All very nice and innovative.
I have no usue of a smartphone airbag of some sort. But hear me out on my train of thought:
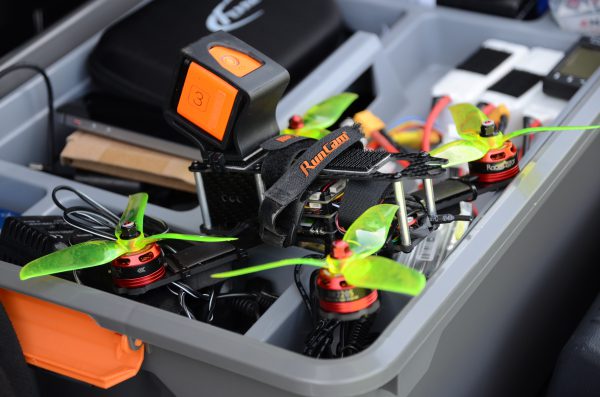
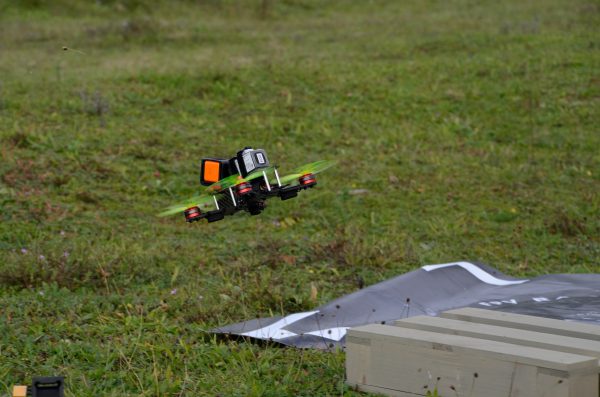
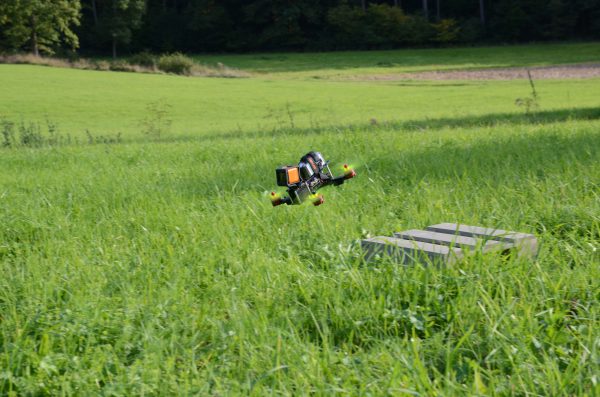
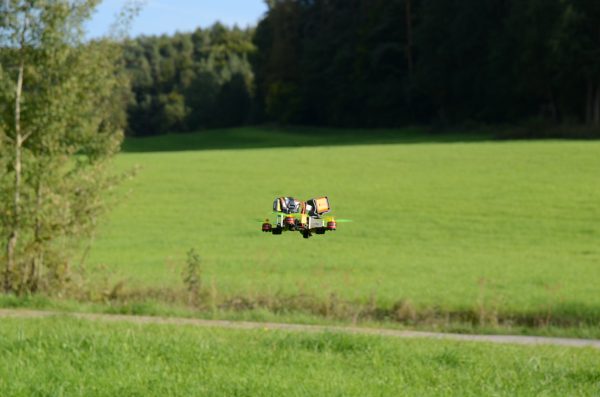
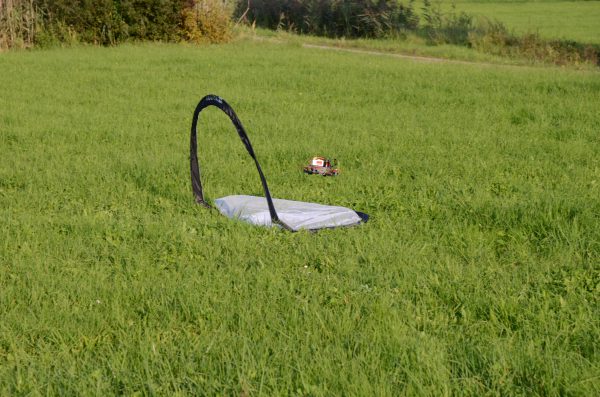
I do partake in the hobby of quadcopter flying. I’ve built some myself in the past.
Now these quadcopters are very powerful and have very short flight times due to their power-dynamics. 4-5 Minutes and you’ve emptied a LiPo pack.
Model airplanes, essentially everything with wings, flys much much longer.
My thought now: Why not have a convertible drone.
When the pilot wants a switch could be flipped and it would convert a low-profile quadcopter to a low-profile quadcopter with wings. Similar to how the above mentioned smartphone “airbag”.
I don’t know anything about mechanics. I have no clue whatsoever. So go figure. But what I do know: the current path of the mini-quad industry is to create more powerful and bigger “mini”-quadcopters. And this is a good direction for some. It’s not for me. Having a 10kg 150km/h 50cm projectile in the air that also delivers a 1kg Lithium-Polymer, highly flammable and explosion-ready battery pack does frighten me.
Why not turn the wheel of innovation into the convertible-in-air-with-much-longer-flight-times direction and make the mini-quadcopters even more interesting?
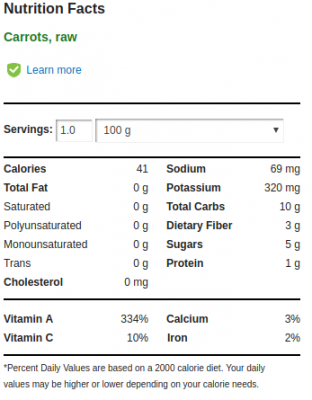
MyFitnessPal is a great online service we are using to track what we eat. It’s well integrated into our daily routine – it works!
Unfortunately MyFitnessPal is not well set-up to interface 3rd party applications with it. In fact it appears they are actively trying to make it harder for externals to utilize the data there.
To access your data there’s an open source project called “python-myfitnesspal” which allows you to interface with MyFitnessPal from the command line. This project uses web-scraping to extract the information from the website and will break everytime MyFitnessPal is changing the design/layout.
Since the output for this would be command line text output it is not of great use for a standardized system. What is needed is to have the data sent in a re-useable way into the automation system.
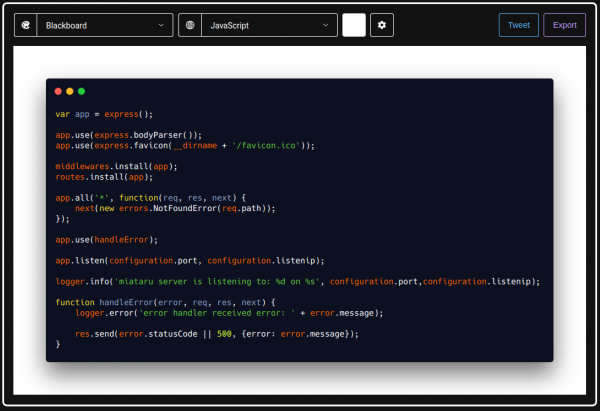
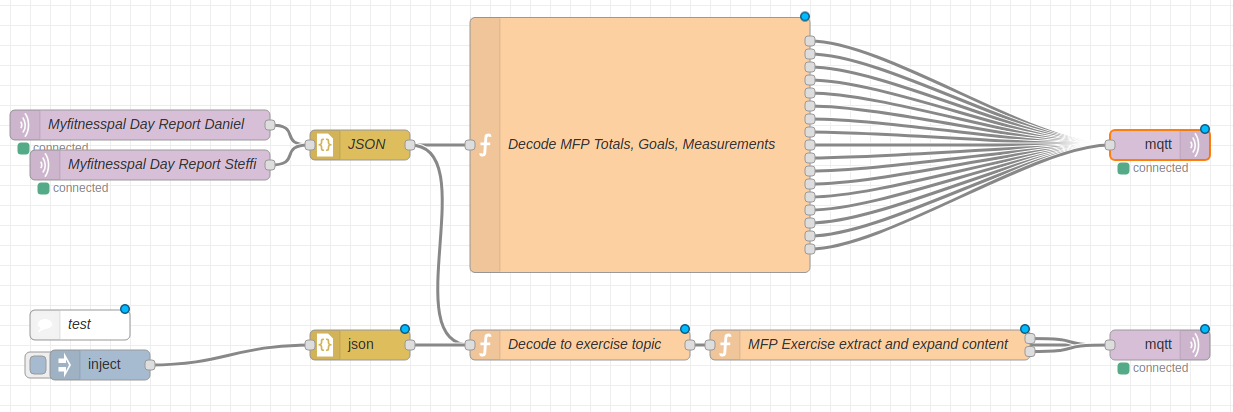
This is why I wrote the additional tool “myfitnesspal2mqtt“. It takes the output provided by python-myfitnesspal and sends it to an MQTT topic. The message then can be decoded, for example with NodeRed, and further processed.
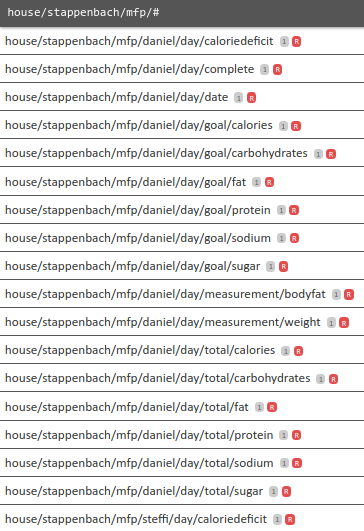
As you can see in the image above I am taking the MQTT message coming from myfitnesspal2mqtt and decoding it with a bit of javascript and outputting it back to MQTT.
In the end it expands into a multitude of topics with one piece of information per MQTT topic.
And with just that every time the script is run (which I do in a docker container and with a cronjob) the whole lot of pieces of information about nutrition and health stats are being pushed and stored in the home automation system.
This way they are of course also available to the home automation system to do things with it.
This experiment great since it’s completely effortless. You link your block lists once and from thereon you keep using Twitter like you always did. Whenever you see a paid promotion you “block it”. Everybody from thereon will not see promotions and timeline entries from this specific Twitter user (unless you would actively follow them).
17326 accounts blocked! Wow! I started with about 3500 before merging with others.
And the effect after about a week is just great! I cannot see a downside so far but the amount of promotion content on my timeline has shrunk to a degree where I do not see any at all.
This is a great way to get rid of content you’ve never wanted and focus on the information you want.
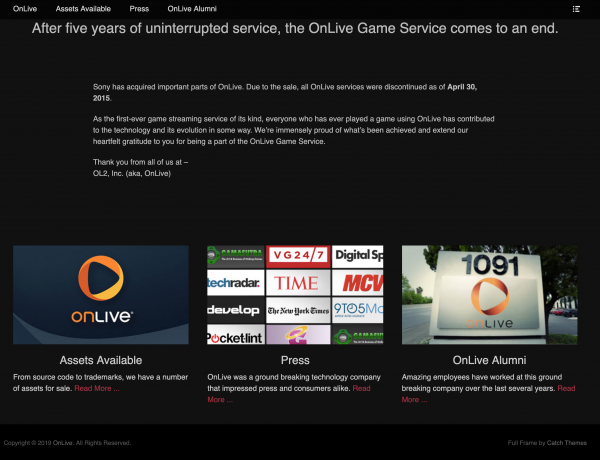
In 2012 I’ve experienced streamed game play for the first time. I was a beta-user of the OnLive service which created a bit of fuzz back then.
Last week Google had announced to step into the game streaming business as well. They’ve announce Google Stadia as the Google powered game streaming platform. It would come with it’s own controller.
3 color variants
And this controller is the most interesting bit. We have seen video live streaming. We have seen and played streamed games. But every time we needed some piece of software or hardware that brought screen, controller and player together.
The Google Stadia controllers now do not connect to the screen in front of you. The screen, by all it knows, just shows a low-latency video/audio stream.
The controller connects to your wifi and directly to the game session. Everything you input with the controller will be directly sent to the Google Stadia session in a Google datacenter. No dedicated console hardware in between. And this will make a huge difference. Because all of a sudden the screen only is a screen. And the controller will connect to the “cloud-console” far-far away. As if it was sitting right below the screen. This will make a huge difference!
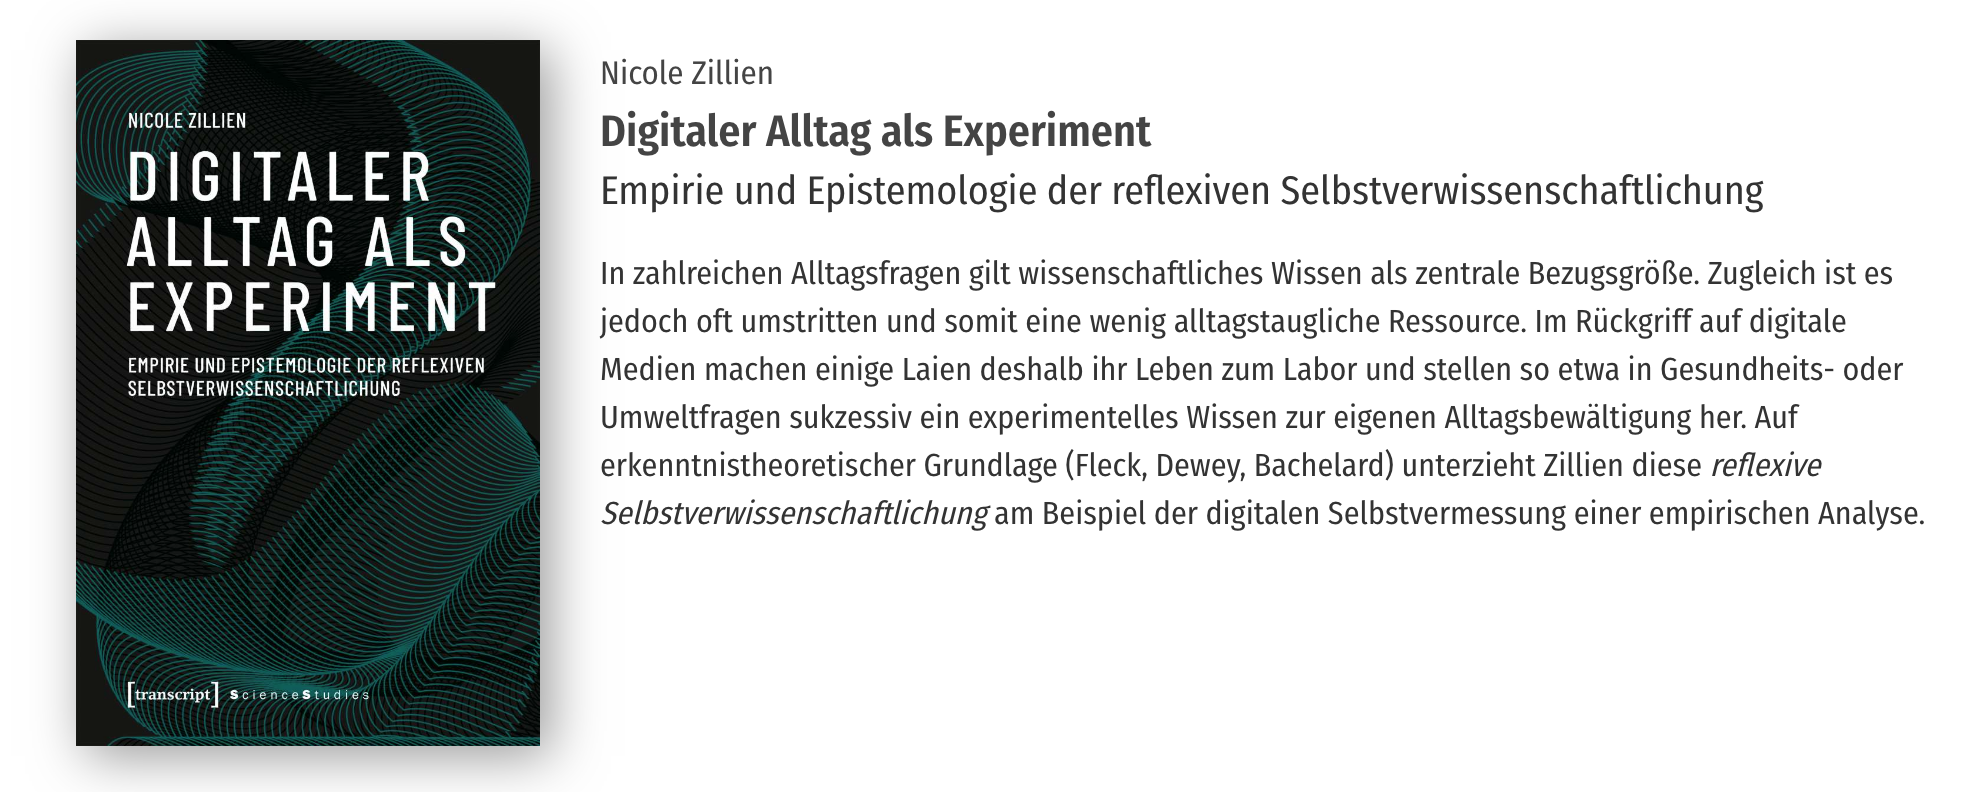
Last week we were approached by Prof. Dr. Nicole Zillien from Justus-Liebig-University in Gießen/Germany. She explained to us that she currently is working on a book.
In this book an empirical analysis is carried out on “quantified-self” approaches to real life problems.
With the lot of information and data we had posted on our personal website(s) like this blog and the “loosing weight” webpage apparently we qualified for being mentioned. We were asked if it would be okay to be named in the book or if we wanted to be pseudonymized.
Since everything we have posted online and which is publicly accessible right now can and should be quoted we were happy to give a go-ahead. We’re publishing things because we want it to spur further thoughts.
It will be out at the end of 2019 / beginning of 2020. As soon as it is out we hope to have a review copy to talk about it in this blog once again.
We do not know what exactly is being written and linked to us – we might as well end up as the worst example of all time. But well, then there’s something to learn in that as well.
A couple of days ago I wrote about a Japanese pun I came across while surfing and doing language learning. I wanted to know more about how these kind of language-tricks work in Japan. And this is what I’ve found:
“Japanese puns, or 駄洒落 (dajare), can be not only groan- or laughter-inducing, but they can also help you improve both the depth and breadth of your language ability.”
Ever since I’ve first visited Tokyo in 2012 I fell in love with country, culture and the city. On average I was there 4 times a year to do business.
After leaving Rakuten I went back to Tokyo for a vacation together with my wife in October 2017. The idea was to show her what I was enthusiastically mumbling about all the time when I came back from Japan.
When staying in Tokyo I’ve stayed in different areas across the city. From very center to not-so-much-center. Given the great public transportation and taxi system in Tokyo it always was a great experience.
So after a couple of times I developed a preference for an area that was in walking distance to the Rakuten office, was well connected to the public transport system and offered all sorts of starting-points for daily life on a longer term. It ticked a lot of boxes.
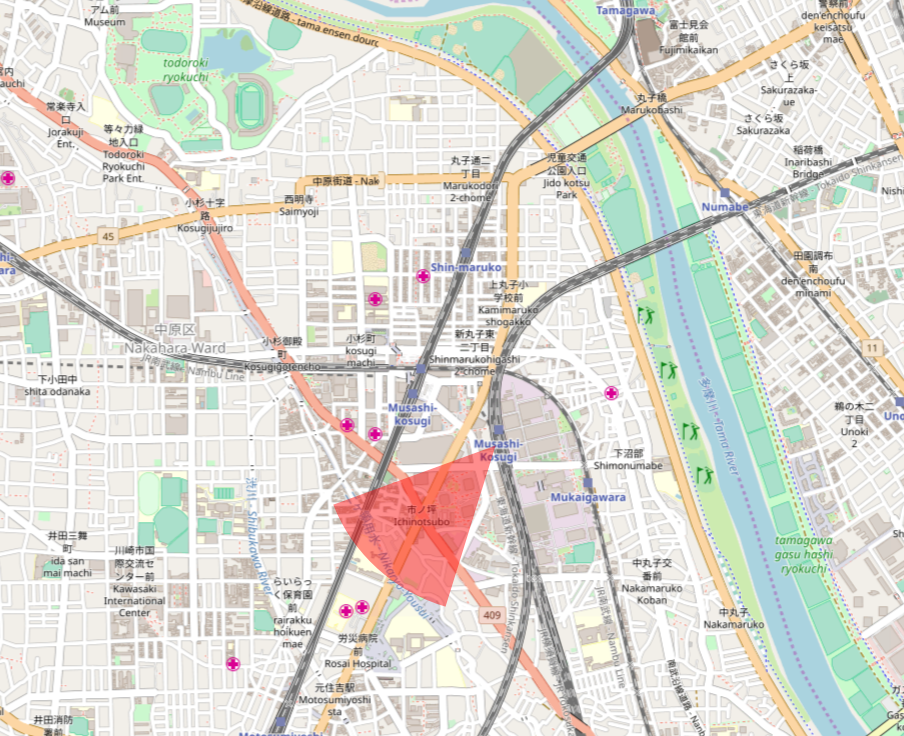
The areas name is Musashi-Kosugi (武蔵小杉). And it actually is in the city of Kawasaki in Kanagawa prefecture. Effectively just across the Tama river from Ota-city in Tokyo prefecture.
Like any great neighborhood everything is conveniently close and the service everywhere is spotless. The hotel of preference is fairly priced and extremely close to the two train stations. So you can get anywhere quick by train.
You can see the hotel location and the train tracks pretty well on this next map. The red portion shows the viewing direction of the night-picture below.
And like any great neighborhood there’s loads of current information available and lots of community activities around the year. In the case of Musashi-Kosugi you can have the more official website and the more up-to-date blog.
If you plan to visit Tokyo I can only recommend you take a look at more off center options of accomodation. I’ve always enjoyed being able to leave the center of buzz like Shibuya, Ropongi and get back into my bubble of quietness without compromising on everything else than party-and-entertainment options. Actual longer-term daily-life is much more enjoyable off-center – as you can imagine.
And for the end of this post: Let us enjoy a sunset with parts of the Musashi-Kosugi skyline:
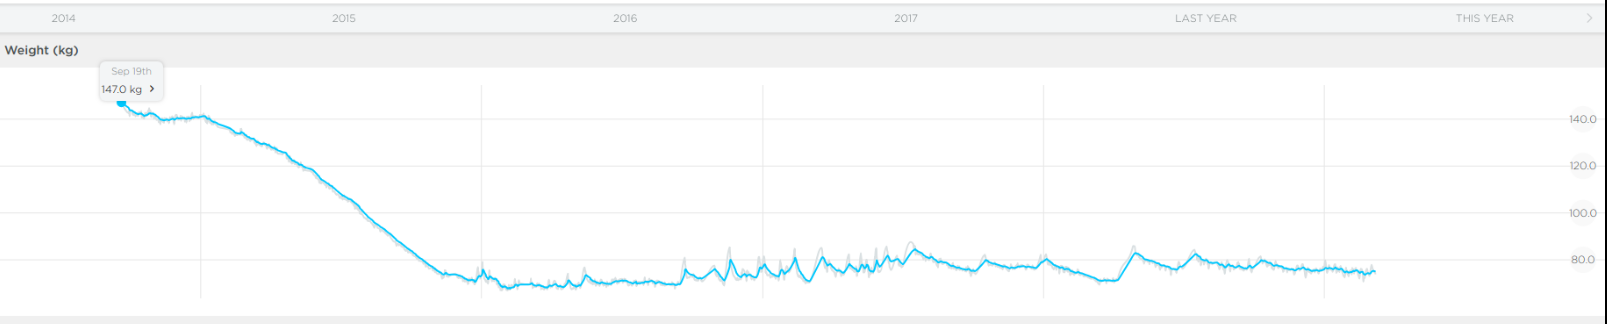
It had been mentioned before: regarding my own health until 2015 I did not have any structure and understanding when it came to food, sports, weight and all that is connected.
I used to be around 147kg (324lbs) when I made the decision to change that. Less than 8 months later I reached the weight that is considered “normal weight” for my body height.
Maybe more important than losing weight and going from class III obesity to normal is to keep in the range offering the biggest health benefits.
2015 till today
Apart from sport and being more active the key to managing weight in general for me was to understand and keep learning about food from many different perspectives.
Like in good science to learn more and make progress you got to listen and take well notes. Some things only can be understood when there’s enough historical data available. Not only the amount of time logged but also what is being logged is quite important.
In a normal week I am used to one-meal-a-day which I am preparing myself together with my wife. We eat in the evening – this makes things so much easier as there’s one time and space where everything regarding food comes together during routine days.
Also this routine works well in the long run. If we only got 10 minutes to prepare we will be able to hit the nutrition targets with either much or not-so-much quantities of food. In the last 4 years we practiced and played and created recipes for all situations you can think of. In a way we have made our simple-and-healthy-recipes the fall-back position we are using when we otherwise would have eaten something unhealthy.
Where do we track? There are so many options but since 2015 we stick to MyFitnessPal.
4+ years constant tracking
We are still happy using this as the base for tracking as the app is bearable even on Android and the food database that it uses is offering a good-enough data detail level.
So after more than 4 years of doing this a lot of data as come together. As I am doing it in sync with my wife a lot of things happened…
We have not become vegans. We eat meat still and we still like it. It’s just that the quality of meat we eat has gotten much better and with this the number of times we eat meat have reduced to maybe once a week at most.
We have started to eat things and experiment cooking with ingredients we did not know a year ago. While we keep adding ingredients all the time we find that you can optimize and gain so much joy from just jumping in head first into new tastes and recipes.
We’ve developed a “body-feel”. Apart from the taste buds changing completely over time I could not have thought of how much food influences how you feel. Different nutritious values lead to very different feels afterwards. I would go as far to say that most of the headaches I very frequently had while being overweight could have been traced back to what I’ve eaten just before.
So what now? We will keep tracking. Maybe not on a cloud service but on our self-hosted service. Maybe you got a good hint towards such self-hosted solutions to enter and track nutrition over time.
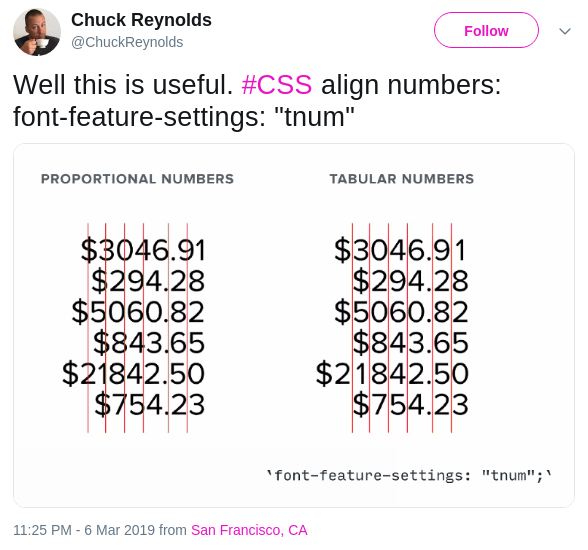
This feature replaces numeral glyphs set on glyph-specific (proportional) widths with corresponding glyphs set on uniform (tabular) widths. Note that some fonts may contain tabular figures by default, in which case enabling this feature may not appear to affect the width of glyphs.
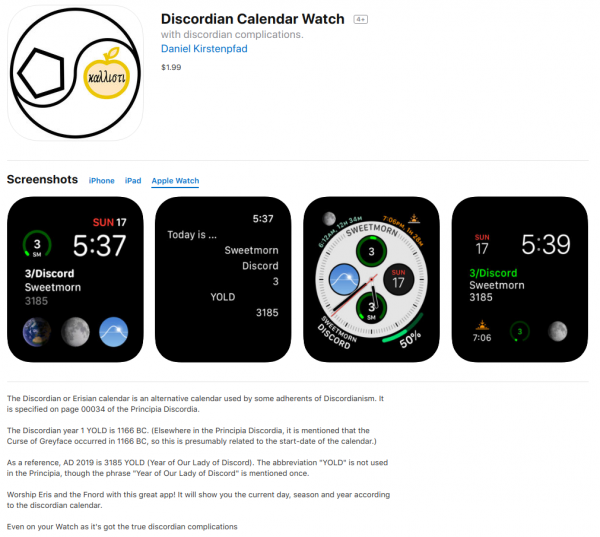
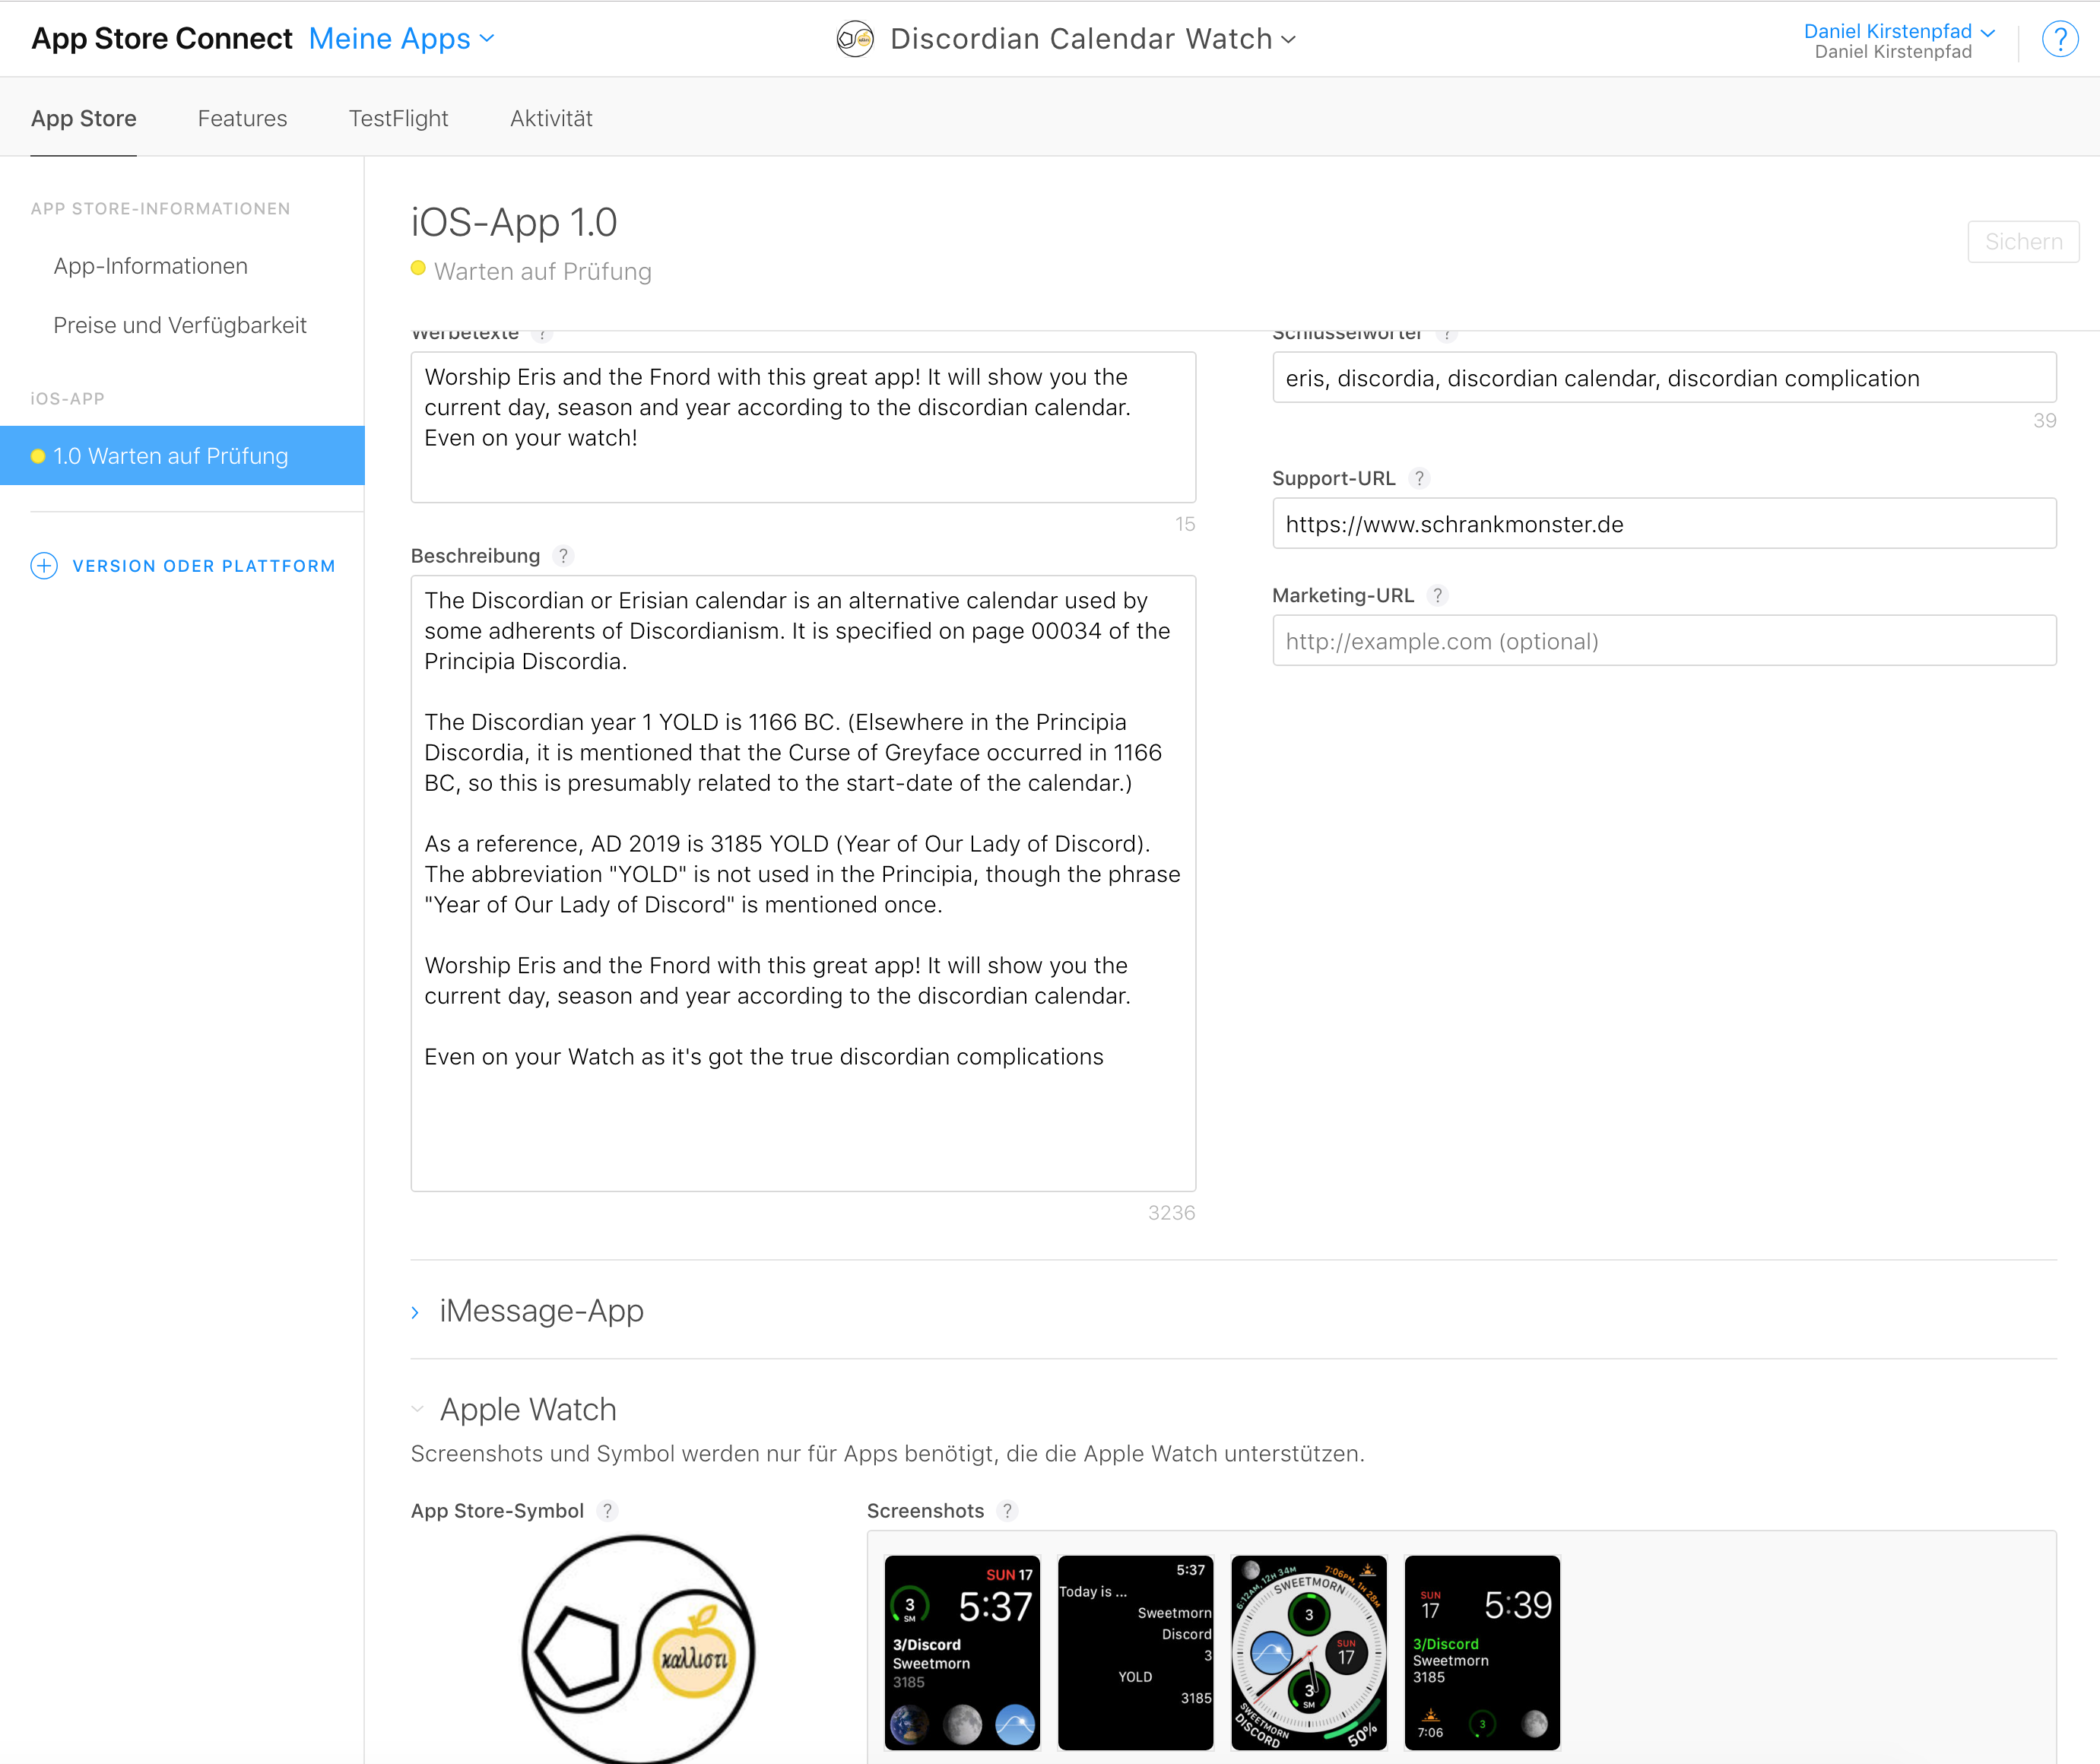
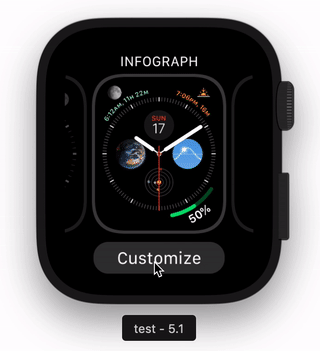
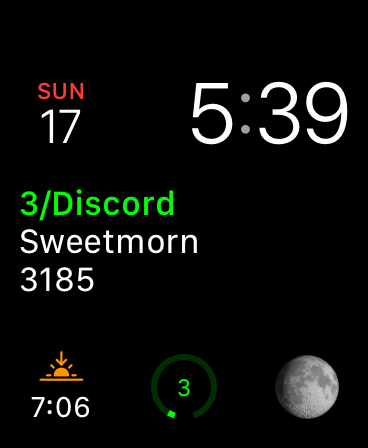
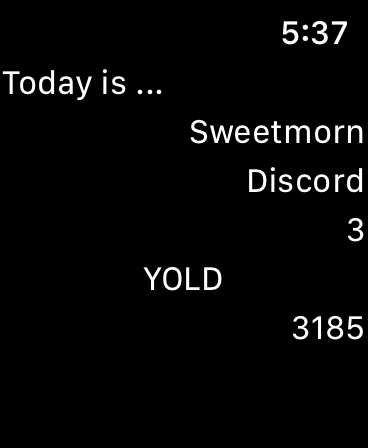
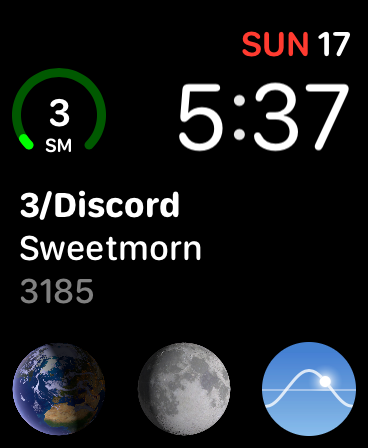
I’ve finished my little coding exercise today. With a good sunday afternoon used to understand and develop an iOS and Watch application from scratch I just handed it in for Apple AppStore approval.
The main purpose, aside from the obvious “learning how it’s done”, is that I actually needed a couple of complications on my watch that would show me the current day/date in the discordian calendar.
I have to say that the overall process of developing iOS and Watch applications is very streamlined. Much much easier than Android development.
The WatchKit development was probably the lesser great experience in this project. There simply is not a lot of code / documentation and examples for WatchKit yet. And most of them are in Swift – which I have not adapted yet. I keep to Objective-C for now still. With Swift at version 5 and lots of upgrades I would have done in the last years just to keep up with the language development… I guess with my choice to stick to Objective-C I’ve avoided a lot of work.
Anyhow! As soon as the app is through AppStore approval I will write again. Maybe somebody actually wants to use it also? :-)
With writing the app I just came up with the next idea for a complication I just really really would need.
In a nutshell: A complication that I can configure to track a certain calendar. And it will show the time in days/hours/minutes until the next appointment in that specific calendar. I will have it set up to show “how many hours till wakeing up”.
In the interesting field of IoT a lot of buzz is made around the predictive maintenance use cases. What is predictive maintenance?
The main promise of predictive maintenance is to allow convenient scheduling of corrective maintenance, and to prevent unexpected equipment failures.
The key is “the right information in the right time”. By knowing which equipment needs maintenance, maintenance work can be better planned (spare parts, people, etc.) and what would have been “unplanned stops” are transformed to shorter and fewer “planned stops”, thus increasing plant availability. Other potential advantages include increased equipment lifetime, increased plant safety, fewer accidents with negative impact on environment, and optimized spare parts handling.
So in simpler terms: If you can predict that something will break you can repair it before it breaks. This improvse reliability and save costs, even though you repaired something that did not yet need repairs. At least you would be able to reduce inconveniences by repairing/maintaining when it still is easy to be done rather than under stress.
You would probably agree with me that these are a very industry-specific use cases. It’s easy to understand when it is tied to an actual case that happened.
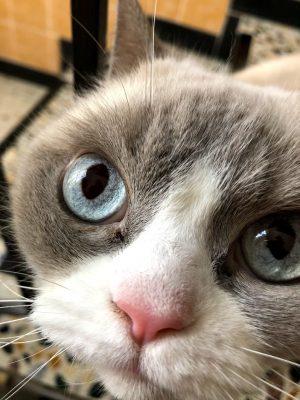
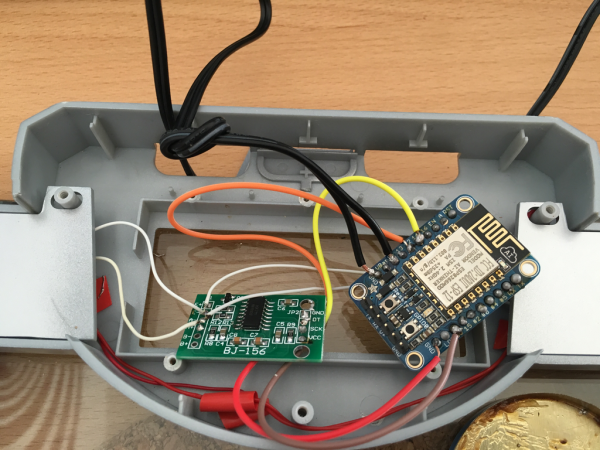
Let me tell you a case that happened here last week. It happened to Leela – a 10 year old white British short hair lady cat with gorgeous blue eyes:
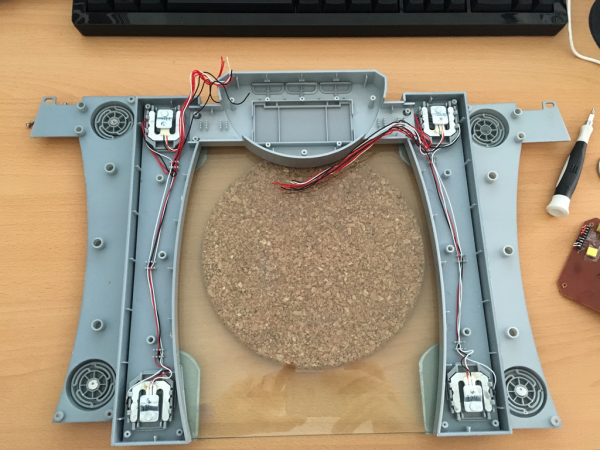
Ever since her sister had developed a severe kidney issue we started to unobtrusively monitor their behavior and vital signs. Simple things like weight, food intake, water intake, movement, regularities (how often x/y/z).
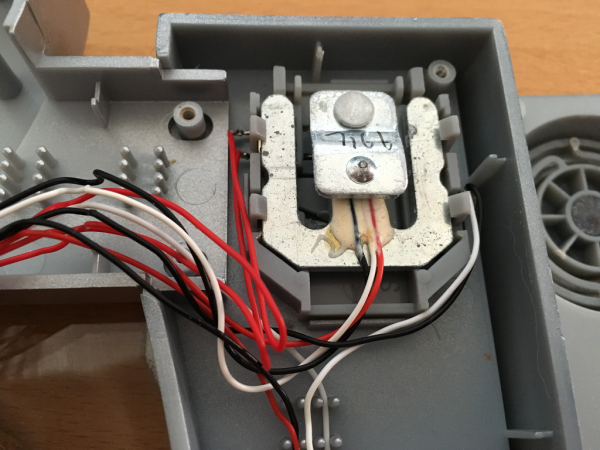
I’ve built hardware to allow us to do that in the most simple and automated way. In the case of getting to know their weight we would simply put the kitty litter box on a heavily modified persons scale. I wrote about that already back int 2016.
When Leela now visits her litter box she is automatically weighed and it’s taken note that she actually used it.
A lot of data is aggregated on this and a lot of things are being done to that data to generate indications of issues and alerts.
This alerted us last weekend that there could be an issue with Leelas health as she was suddenly visiting the litter box a lot more often across the day.
We did not notice anything with Leela. She behaved as she would everyday, but the monitoring did detect something was not right.
What had happened?
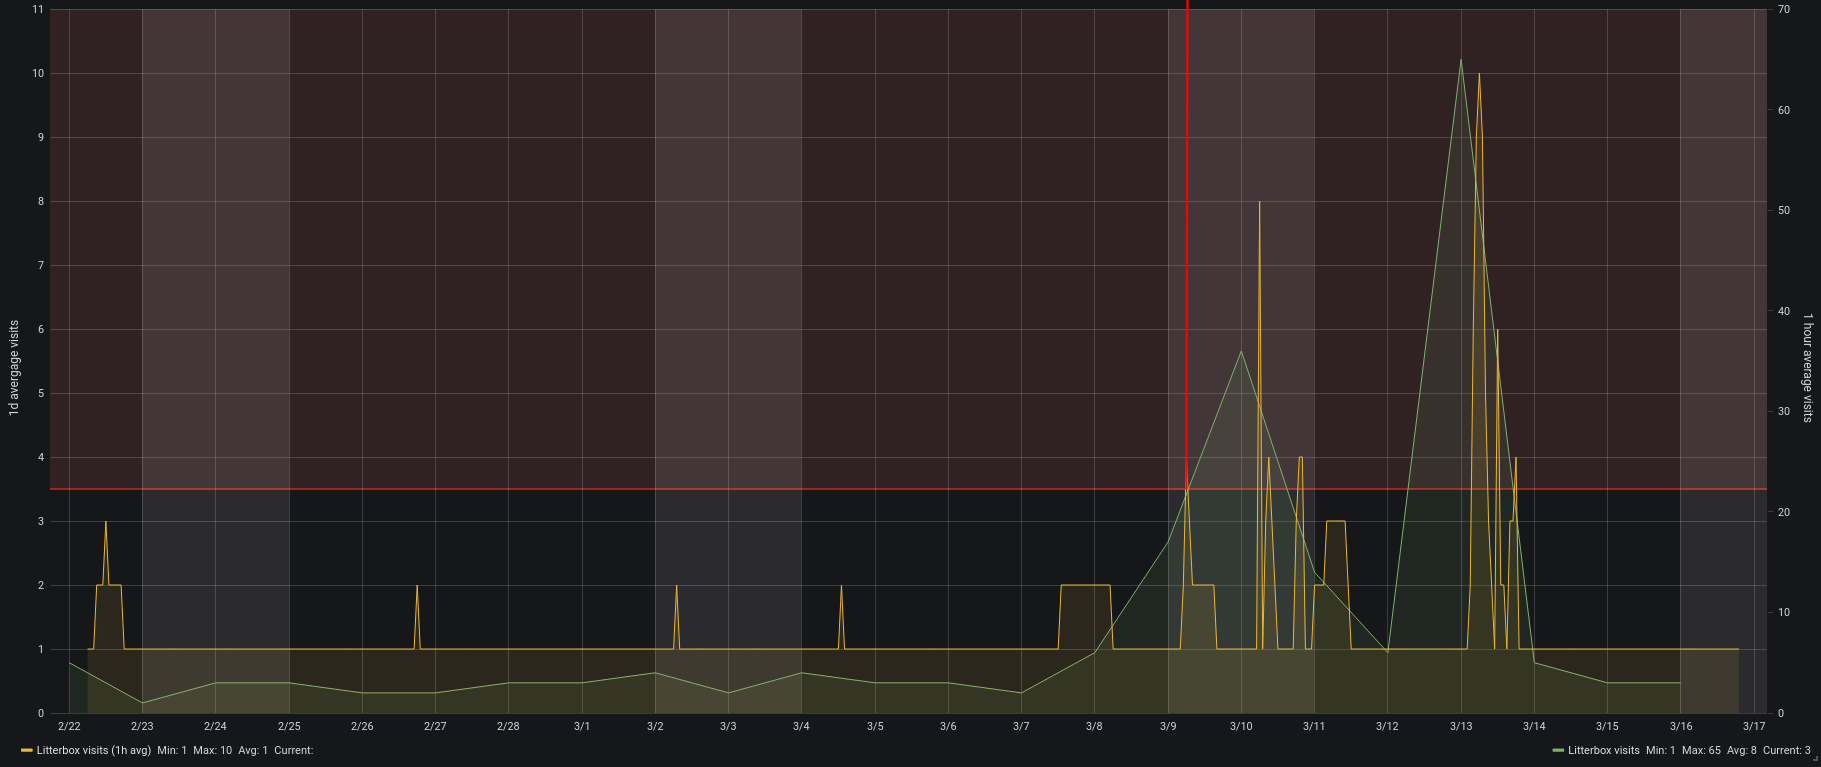
The chart shows the hourly average and daily total visits to the litterbox.
On the morning of March 9th Leela already had been to the litter box above average. So much above average that it tripped the alerting system. You can see the faded read area in the top of the graph above showing the alert threshold. The red vertical line was drawn in by me because this was when we got alerted.
Now what? She behaved totally normal just that she went a lot more to the litter box. We where concerned as it matched her sisters behavior so we went through all the checklists with her on what the issue could be.
We monitored her closely and increased the water supplied as well as changed her food so she could fight a potential bladder infection (or worse).
By Monday she did still not behave different to a degree that anyone would have been suspicious. Nevertheless my wife took her to the vet. And of course a bladder infection was diagnosed after all tests run.
She got antibiotics and around Wednesday (13th March) she actually started to behave much like a sick cat would. By then she already was on day 3 of antibiotics and after just one day of presumable pain she was back to fully normal.
Interestingly all of this can be followed up with the monitoring. Even that she must have felt worse on the 13th.
With everything back to normal now it seems that this monitoring has really lead us to a case of “predictive cat maintenance”. We hopefully could prevent a lot of pain with acting quick. Which only was possible through the monitoring in place.
Monitoring pets is seemingly becoming a thing – which lead to my rather funky post title declaration of the “Internet of Pets”. I know about a certain Volker Weber who even wrote in the current c’t magazine about him monitoring his dogs location.
Health is a huge topic for the future of devices and gadgets. Everyone will casually start to have more and more devices in their daily lifes. Unfortunately most of those won’t be under your own control if you do not insist on being in control.
You do not have to build stuff yourself like I did. You only need to make the right purchase decisions according to things important to you. And one of these things on that checklist should be: “am I in full control of the data flow and data storage”.
If you are not. Do not buy!
By coincidence the idea of having the owner of the data in full control of the data itself is central to my current job at MindSphere. With all the buzz and whistles around the Industry IoT platform it all breaks down to keep the actual owner of the data in control and in charge. A story for another post!
You want or you have to use shells – command line interfaces. And it’s something that always leads to stackoverflow / google sessions. Or you’re studying man-pages for hours.
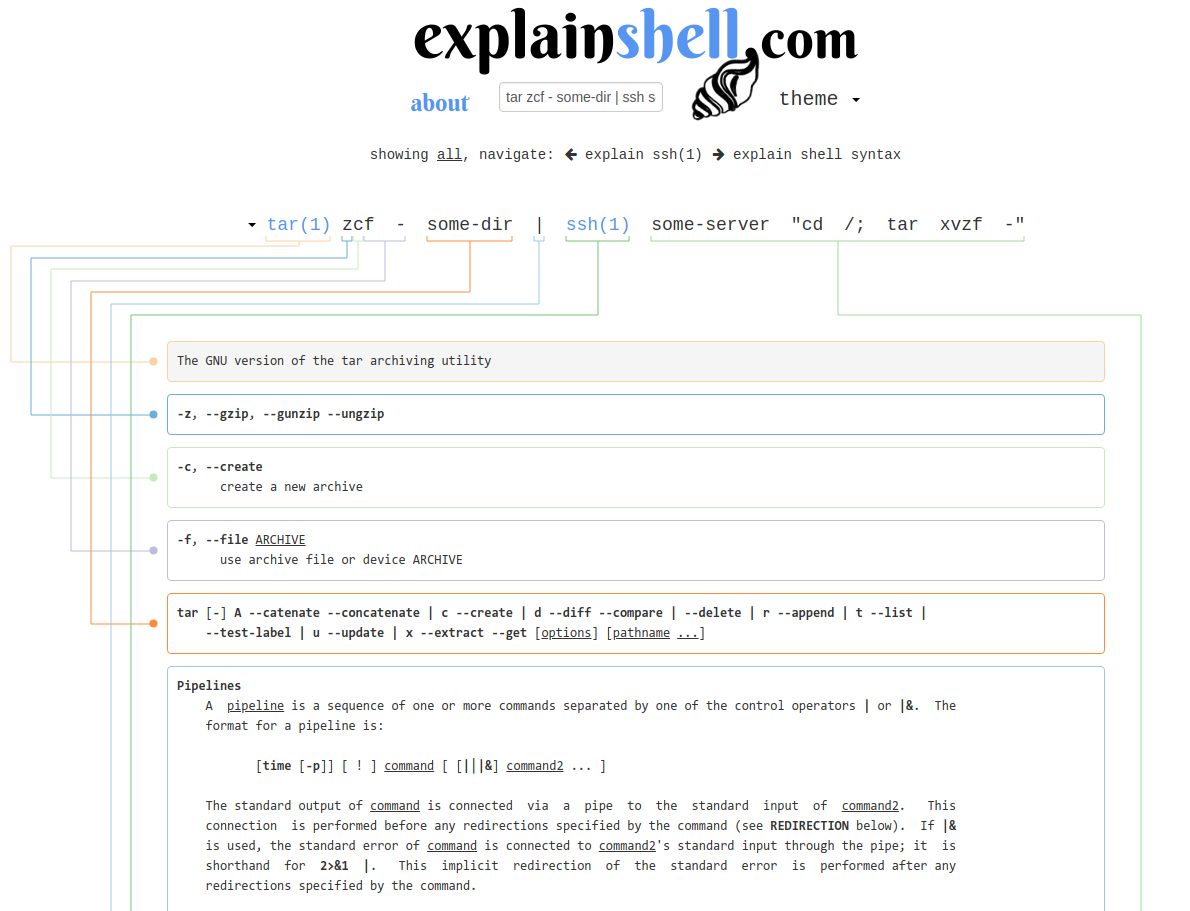
But there’s a better way to view and understand these man-pages. There’s explainshell.com. Here is an example of what it can do:
As you can see it not only takes one command and shows you the meaning/function of a parameter. But it takes complex structured commands and unfolds it for you nicely onto a web page. Even the harder examples:


![var complete = {};
var sodium = {};
var carbohydrates = {};
var calories = {};
var daydate = {};
var fat = {};
var sugar = {};
var protein = {};
var weight = {};
var bodyfat = {};
var goalsodium = {};
var goalcarbohydrates = {};
var goalcalories = {};
var goalfat = {};
var goalsugar = {};
var goalprotein = {};
var caloriesdiff = {};
var ttopic = msg.topic.toLowerCase();
var firstobject = Object.keys(msg.payload)[0];
complete.payload = msg.payload[firstobject].complete;
complete.topic = ttopic+'/complete';
sodium.payload = msg.payload[firstobject].totals.sodium;
sodium.topic = ttopic+'/total/sodium';
carbohydrates.payload = msg.payload[firstobject].totals.carbohydrates;
carbohydrates.topic = ttopic+'/total/carbohydrates';
calories.payload = msg.payload[firstobject].totals.calories;
calories.topic = ttopic+'/total/calories';
fat.payload = msg.payload[firstobject].totals.fat;
fat.topic = ttopic+'/total/fat';
sugar.payload = msg.payload[firstobject].totals.sugar;
sugar.topic = ttopic+'/total/sugar';
protein.payload = msg.payload[firstobject].totals.protein;
protein.topic = ttopic+'/total/protein';
weight.payload = msg.payload[firstobject].measurements.weight;
weight.topic = ttopic+'/measurement/weight';
bodyfat.payload = msg.payload[firstobject].measurements.bodyfat;
bodyfat.topic = ttopic+'/measurement/bodyfat';
goalsodium.payload = msg.payload[firstobject].goals.sodium;
goalsodium.topic = ttopic+'/goal/sodium';
goalcarbohydrates.payload = msg.payload[firstobject].goals.carbohydrates;
goalcarbohydrates.topic = ttopic+'/goal/carbohydrates';
goalcalories.payload = msg.payload[firstobject].goals.calories;
goalcalories.topic = ttopic+'/goal/calories';
goalfat.payload = msg.payload[firstobject].goals.fat;
goalfat.topic = ttopic+'/goal/fat';
goalsugar.payload = msg.payload[firstobject].goals.sugar;
goalsugar.topic = ttopic+'/goal/sugar';
goalprotein.payload = msg.payload[firstobject].goals.protein;
goalprotein.topic = ttopic+'/goal/protein';
caloriesdiff.payload = msg.payload[firstobject].goals.calories - msg.payload[firstobject].totals.calories;
caloriesdiff.topic = ttopic+'/caloriedeficit';
daydate.payload = firstobject;
daydate.topic = ttopic+"/date";
return [complete, sodium, carbohydrates, calories, fat, sugar, protein, weight, bodyfat, goalsodium, goalcarbohydrates, goalcalories, goalfat, goalsugar, goalprotein, daydate, caloriesdiff];](https://www.schrankmonster.de/wp-content/uploads/2019/03/Bildschirmfoto-zu-2019-03-22-14-13-41.png)