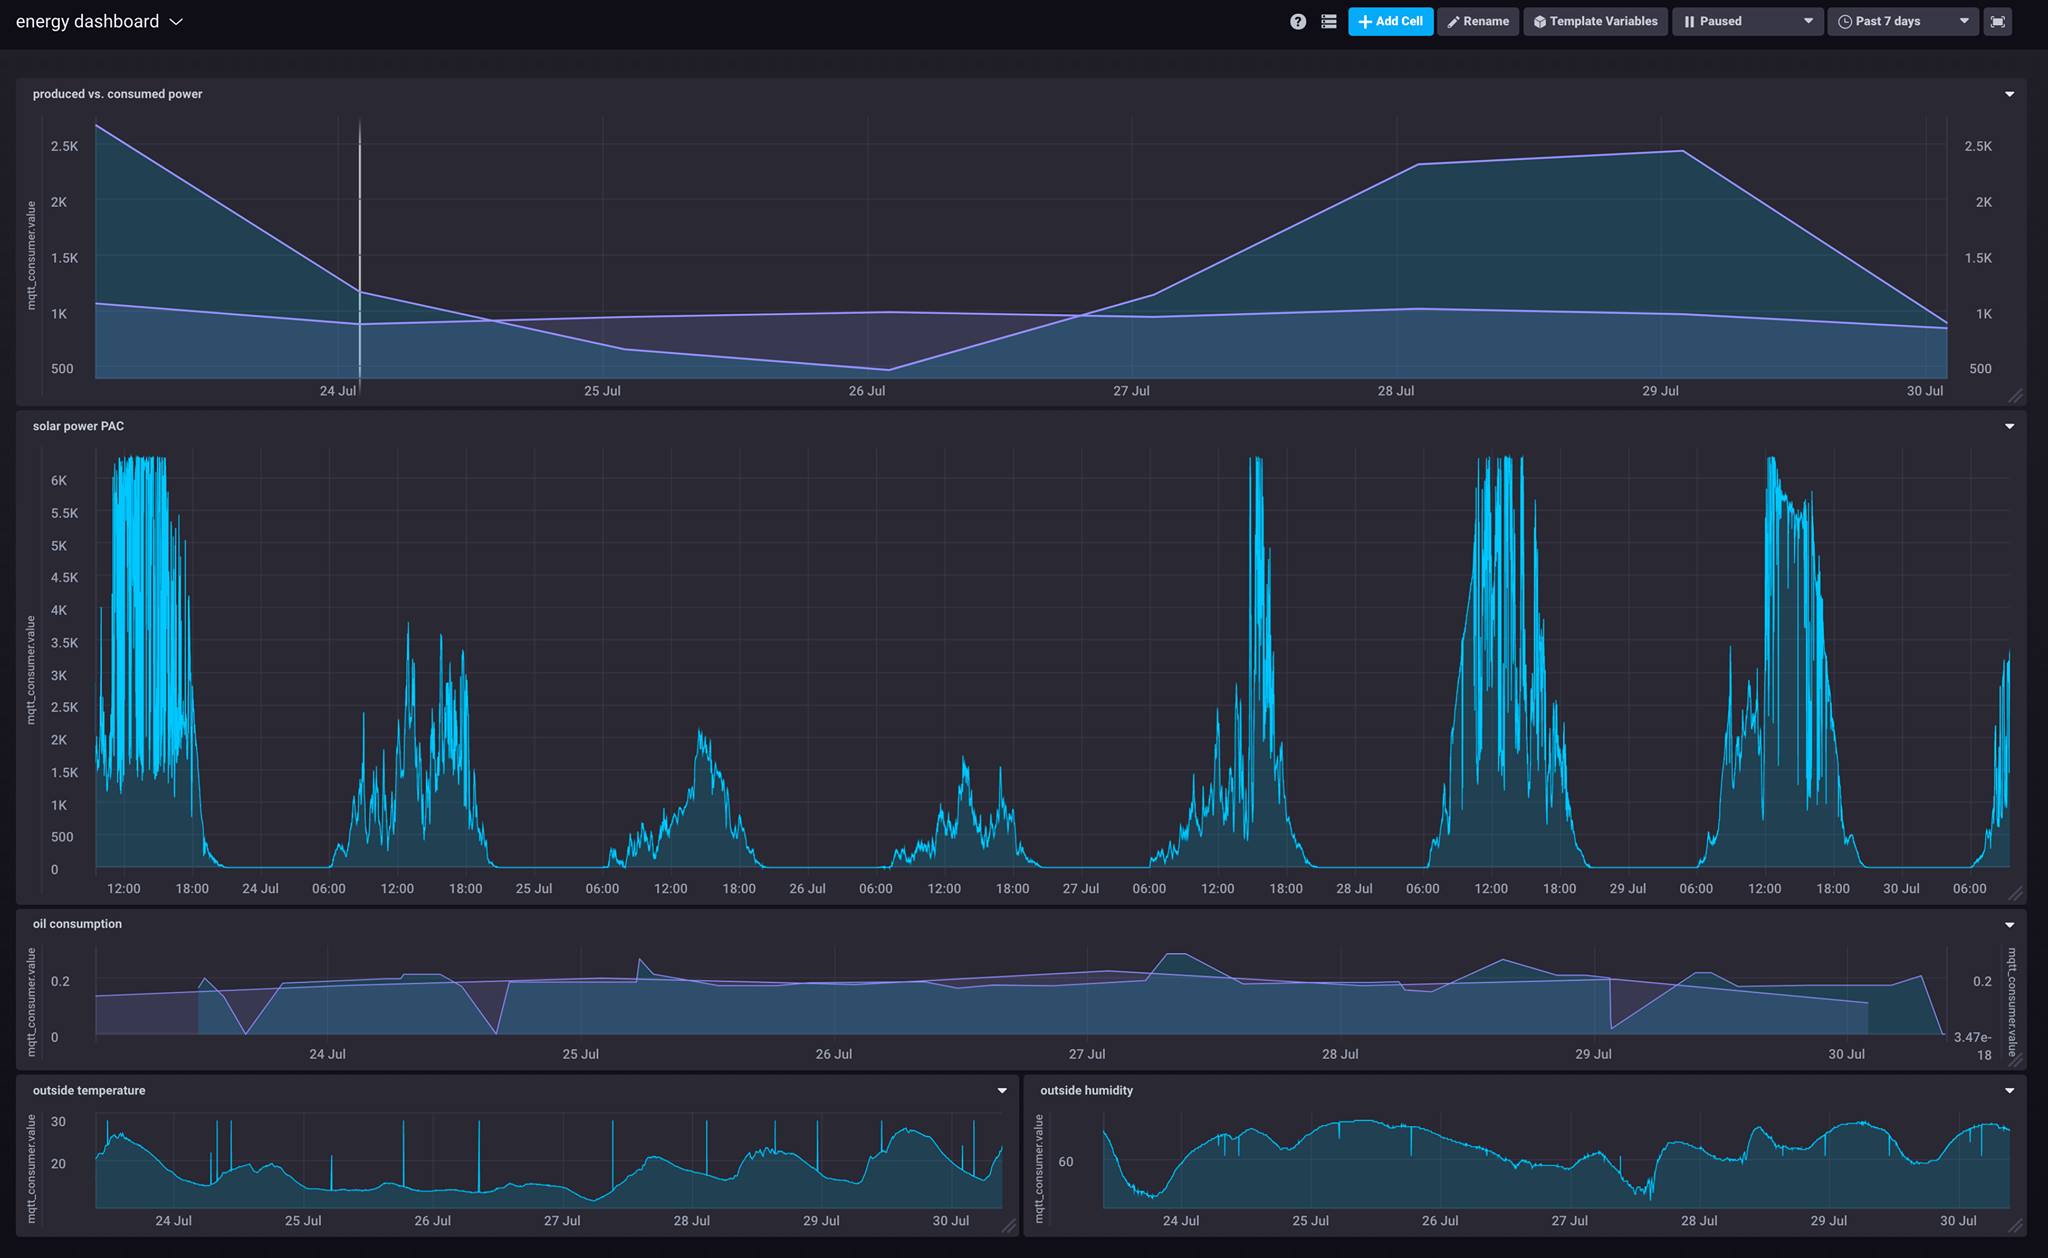
7 day and 30 day graphs for solar power generation, power consumption, oil burn to heat water and outside temperatures to go along with.
Having everything in a time-series-database makes such things a real blast… data wandering around all the telemetry. There are almost 300 topics to pick from and combine.
Yes, generally the solar array produces more than the whole household consumes. Except that one 26th.
Thinking about building a display showing when we are closing in to consume what has been produced in terms of electricity… something like a traffic light getting more red towards the use-up of electricity generated carbon-neutral.