With a „little bit of data sharing“ signed-off just about a couple of seconds after you paid your purchase a PDF file of the receipt you would have gotten at the cashier is in your eMail inbox.
That receipt is a fairly small PDF file looking just like the paper-receipt would have looked like. Additionally you can opt out of the paper receipt – which means less wasted paper as it‘s not even printed out at the cashir.
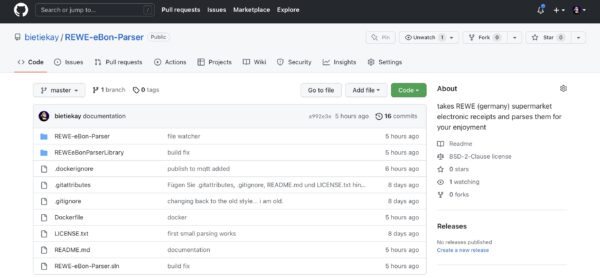
I had accumulated two years of groceries shopping – over 100 receipts until I finally sat down and coded a parser that takes the pdf-receipt, parses it and publishes the results to respective MQTT topics.
When you start the program this way it’ll go through all pdf files in the directory you point it at. If it finds REWE eBons it will read and parse them in.
It will then order the eBons by date and output all of them in the correct timely order to MQTT.
Then it will start watching the directory for any changes and new files. It’ll pick up those files automatically, read them in and send the data to MQTT of the receipt date is newer than the last one seen and sent.
I‘ve wrapped all of it so it would come with a Dockerfile and can be run anywhere where you‘ve got docker up and running.
Now what do I do with this you may ask?
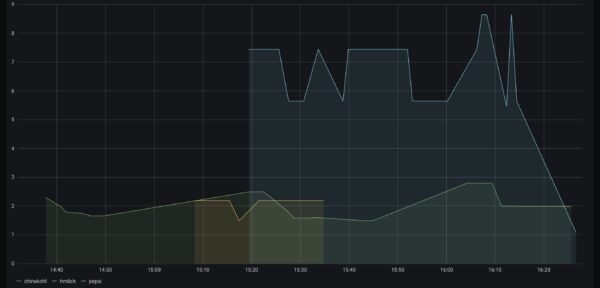
Let me show you an example:
cabbage, milk and pepsi prices plotted out… ignore the hour times – this is from a test import
How I use this is: the tool is running all the time and watching a directory. Whenever a new .PDF file shows up in this directory it will automatically be parsed and it‘s contents pushed out through MQTT. Each item essentially in it‘s own separate topic with price, quantities etc.
Using a combination of Telegraf (to get the data from MQTT to InfluxDB) and InfluxDB (to store time-series) and Grafana (to query and show graphs).
This way it‘s trivial to plot the price development of groceries you regularly purchase. It‘s easy to see what you might have missed.
I am still drilling into the data and there‘s lots of things you can do with it.
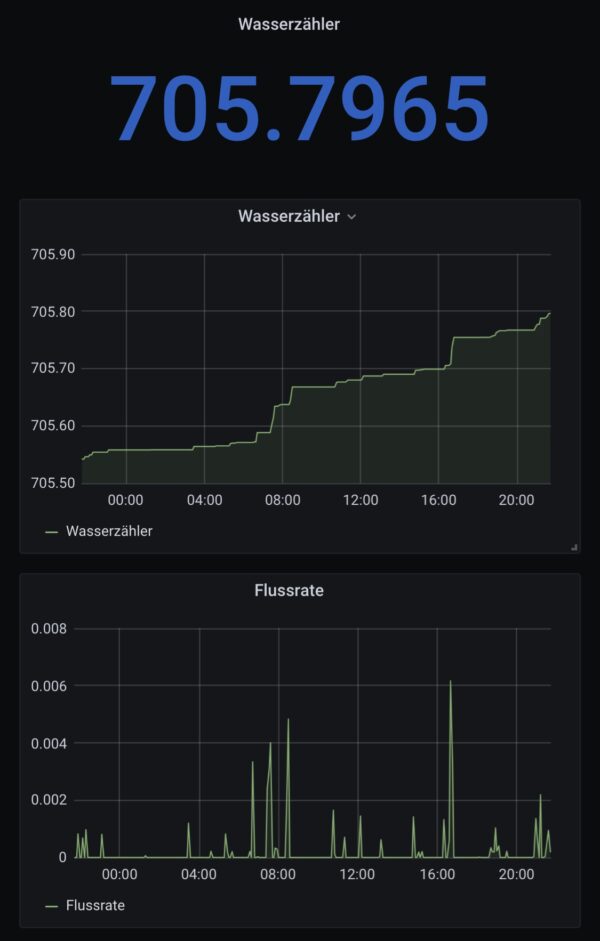
The only meter in our house that I was not yet able to read out automatically was the water meter.
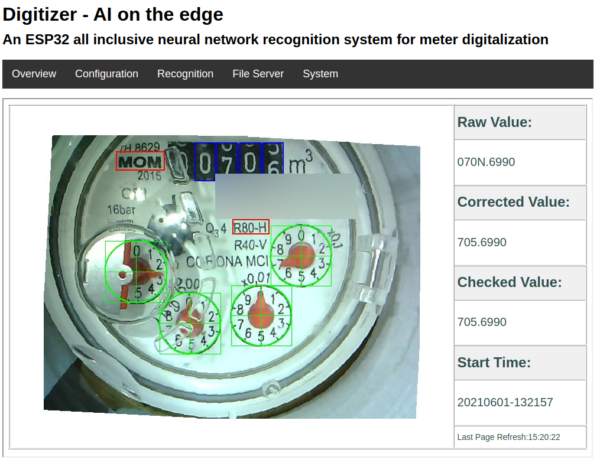
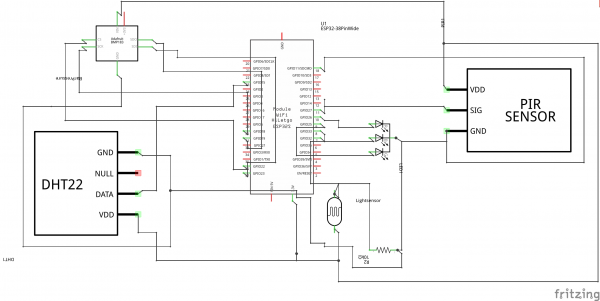
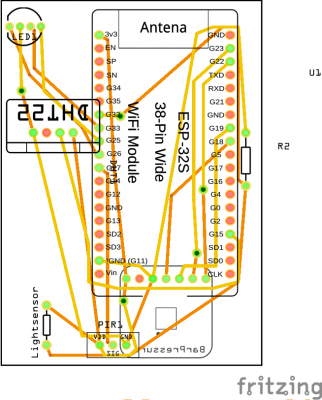
With the help of a great open source project by the name of AI-on-the-edge and an ESP32-Camera Module it is quite simple to regularly take a picture of the meter, convert it into a digital read-out and send it away through MQTT.
The process is quite simple and straightforward.
Flash the ready made Firmware image to the module
Configure the WiFi using a SD card
Put the module directly over the meter
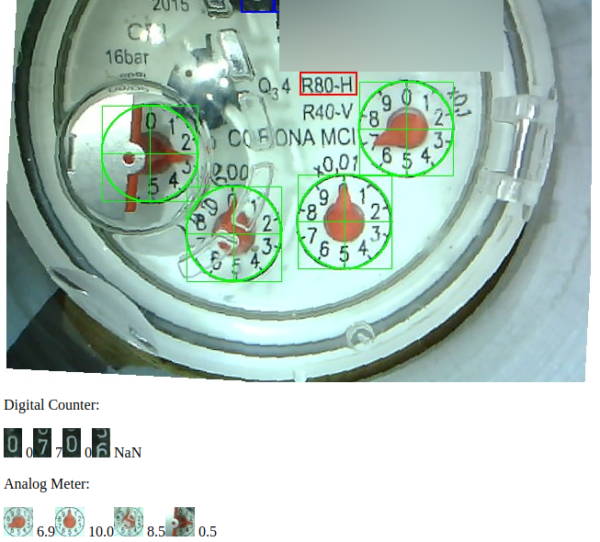
Connect to it and setup the reference points and the meter recognition marks
As you can see above all the recognition is done on the ESP32 module with its 4MByte of RAM.
With the data sent through MQTT it’s easy to draw nice graphs:
When you are dealing with IoT protocols, especially at hobby-level, you probably came across the MQTT protocol and the challenge to have all those different devices that are supposed to be connected actually get connected – preferably using the MQTT protocol.
Recently this little project came to my attention:
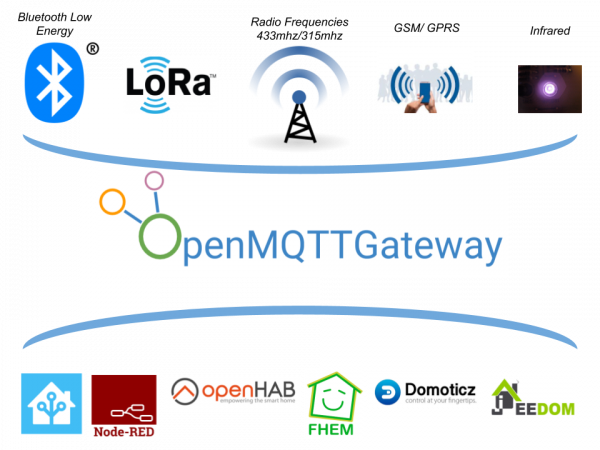
OpenMQTTGateway project goal is to concentrate in one gateway different technologies, decreasing by the way the number of proprietary gateways needed, and hiding the different technologies singularity behind a simple & wide spread communication protocol: MQTT.
OpenMQTTGateway support very mature technologies like basic 433mhz/315mhz protocols & infrared (IR) so as to make your old dumb devices “smart” and avoid you to throw then away. These devices have also the advantages of having a lower cost compared to Zwave or more sophisticated protocols. OMG support also up to date technologies like Bluetooth Low Energy (BLE) or LORA.
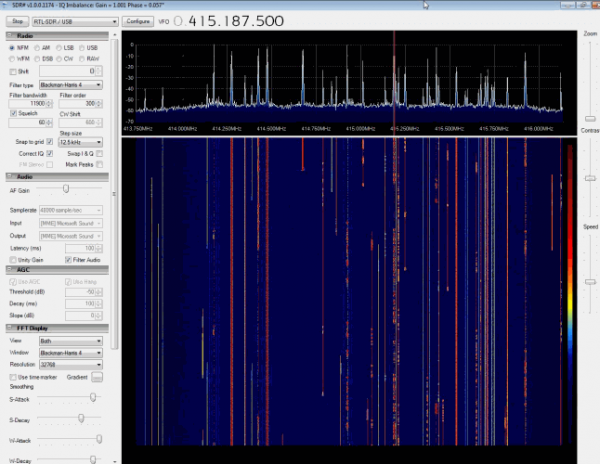
RTL-SDR is a very cheap ~$25 USB dongle that can be used as a computer based radio scanner for receiving live radio signals in your area (no internet required). Depending on the particular model it could receive frequencies from 500 kHz up to 1.75 GHz. Most software for the RTL-SDR is also community developed, and provided free of charge.
The origins of RTL-SDR stem from mass produced DVB-T TV tuner dongles that were based on the RTL2832U chipset. With the combined efforts of Antti Palosaari, Eric Fry and Osmocom (in particular Steve Markgraf) it was found that the raw I/Q data on the RTL2832U chipset could be accessed directly, which allowed the DVB-T TV tuner to be converted into a wideband software defined radio via a custom software driver developed by Steve Markgraf. If you’ve ever enjoyed the RTL-SDR project please consider donating to Osmocom via Open Collective as they are the ones who developed the drivers and brought RTL-SDR to life.
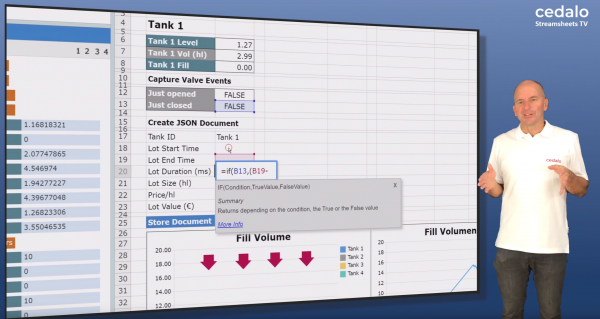
Streamsheets is, similar to NodeRed, a tool to step in between MQTT data coming in and something being done with it. Just other than NodeRed it is not based on flows but on a spreadsheet that executes in it’s entirety everytime a step is made.
Streamsheets are a new spreadsheet technology specifically designed for real-time data stream processing and the opportunities of digitization and the Industrial IoT.
We’ve got several quite big fish tanks in our house. Mainly used by freshwater turtles.
say Hi! to Wilma.
These turtles need to be fed every once in a while. And while this is not an issue normally it’s an issue if you leave the house for travel for an extended period of time.
Of course there are humans checking on everything in the house regularly but as much as can be automated should and will be automated in our household. So the requirement wa to have the turtle feeding automated.
To achieve this is would be necessary to have a fixed amount of turtle food be dispensed into the tanks on a plan and with some checks in the background (like water quality and such).
It’s been quite a hassle to come up with a plan how the hardware should look like and work. And ultimately i’ve settled on retrofitting an off-the-shelf fish pond feeder to become controllable through MQTT.
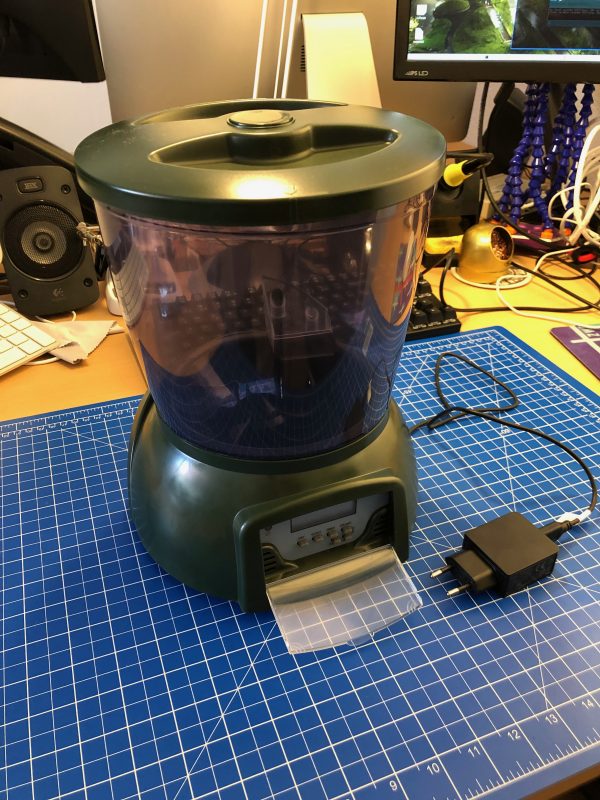
The pond feeder I’ve found and used is this one:
It’s not really worth linking to a specific product detail page as this sort of feeder is available under hundreds of different names. It always looks the same and is priced right around the same.
If you want to build this yourself, you want one that looks like the above. I’ve bought 3 of them and they all seem to come out of the same factory somewhere in China.
Anyway. If you got one you can easily open it up and start modifying it.
Hardware
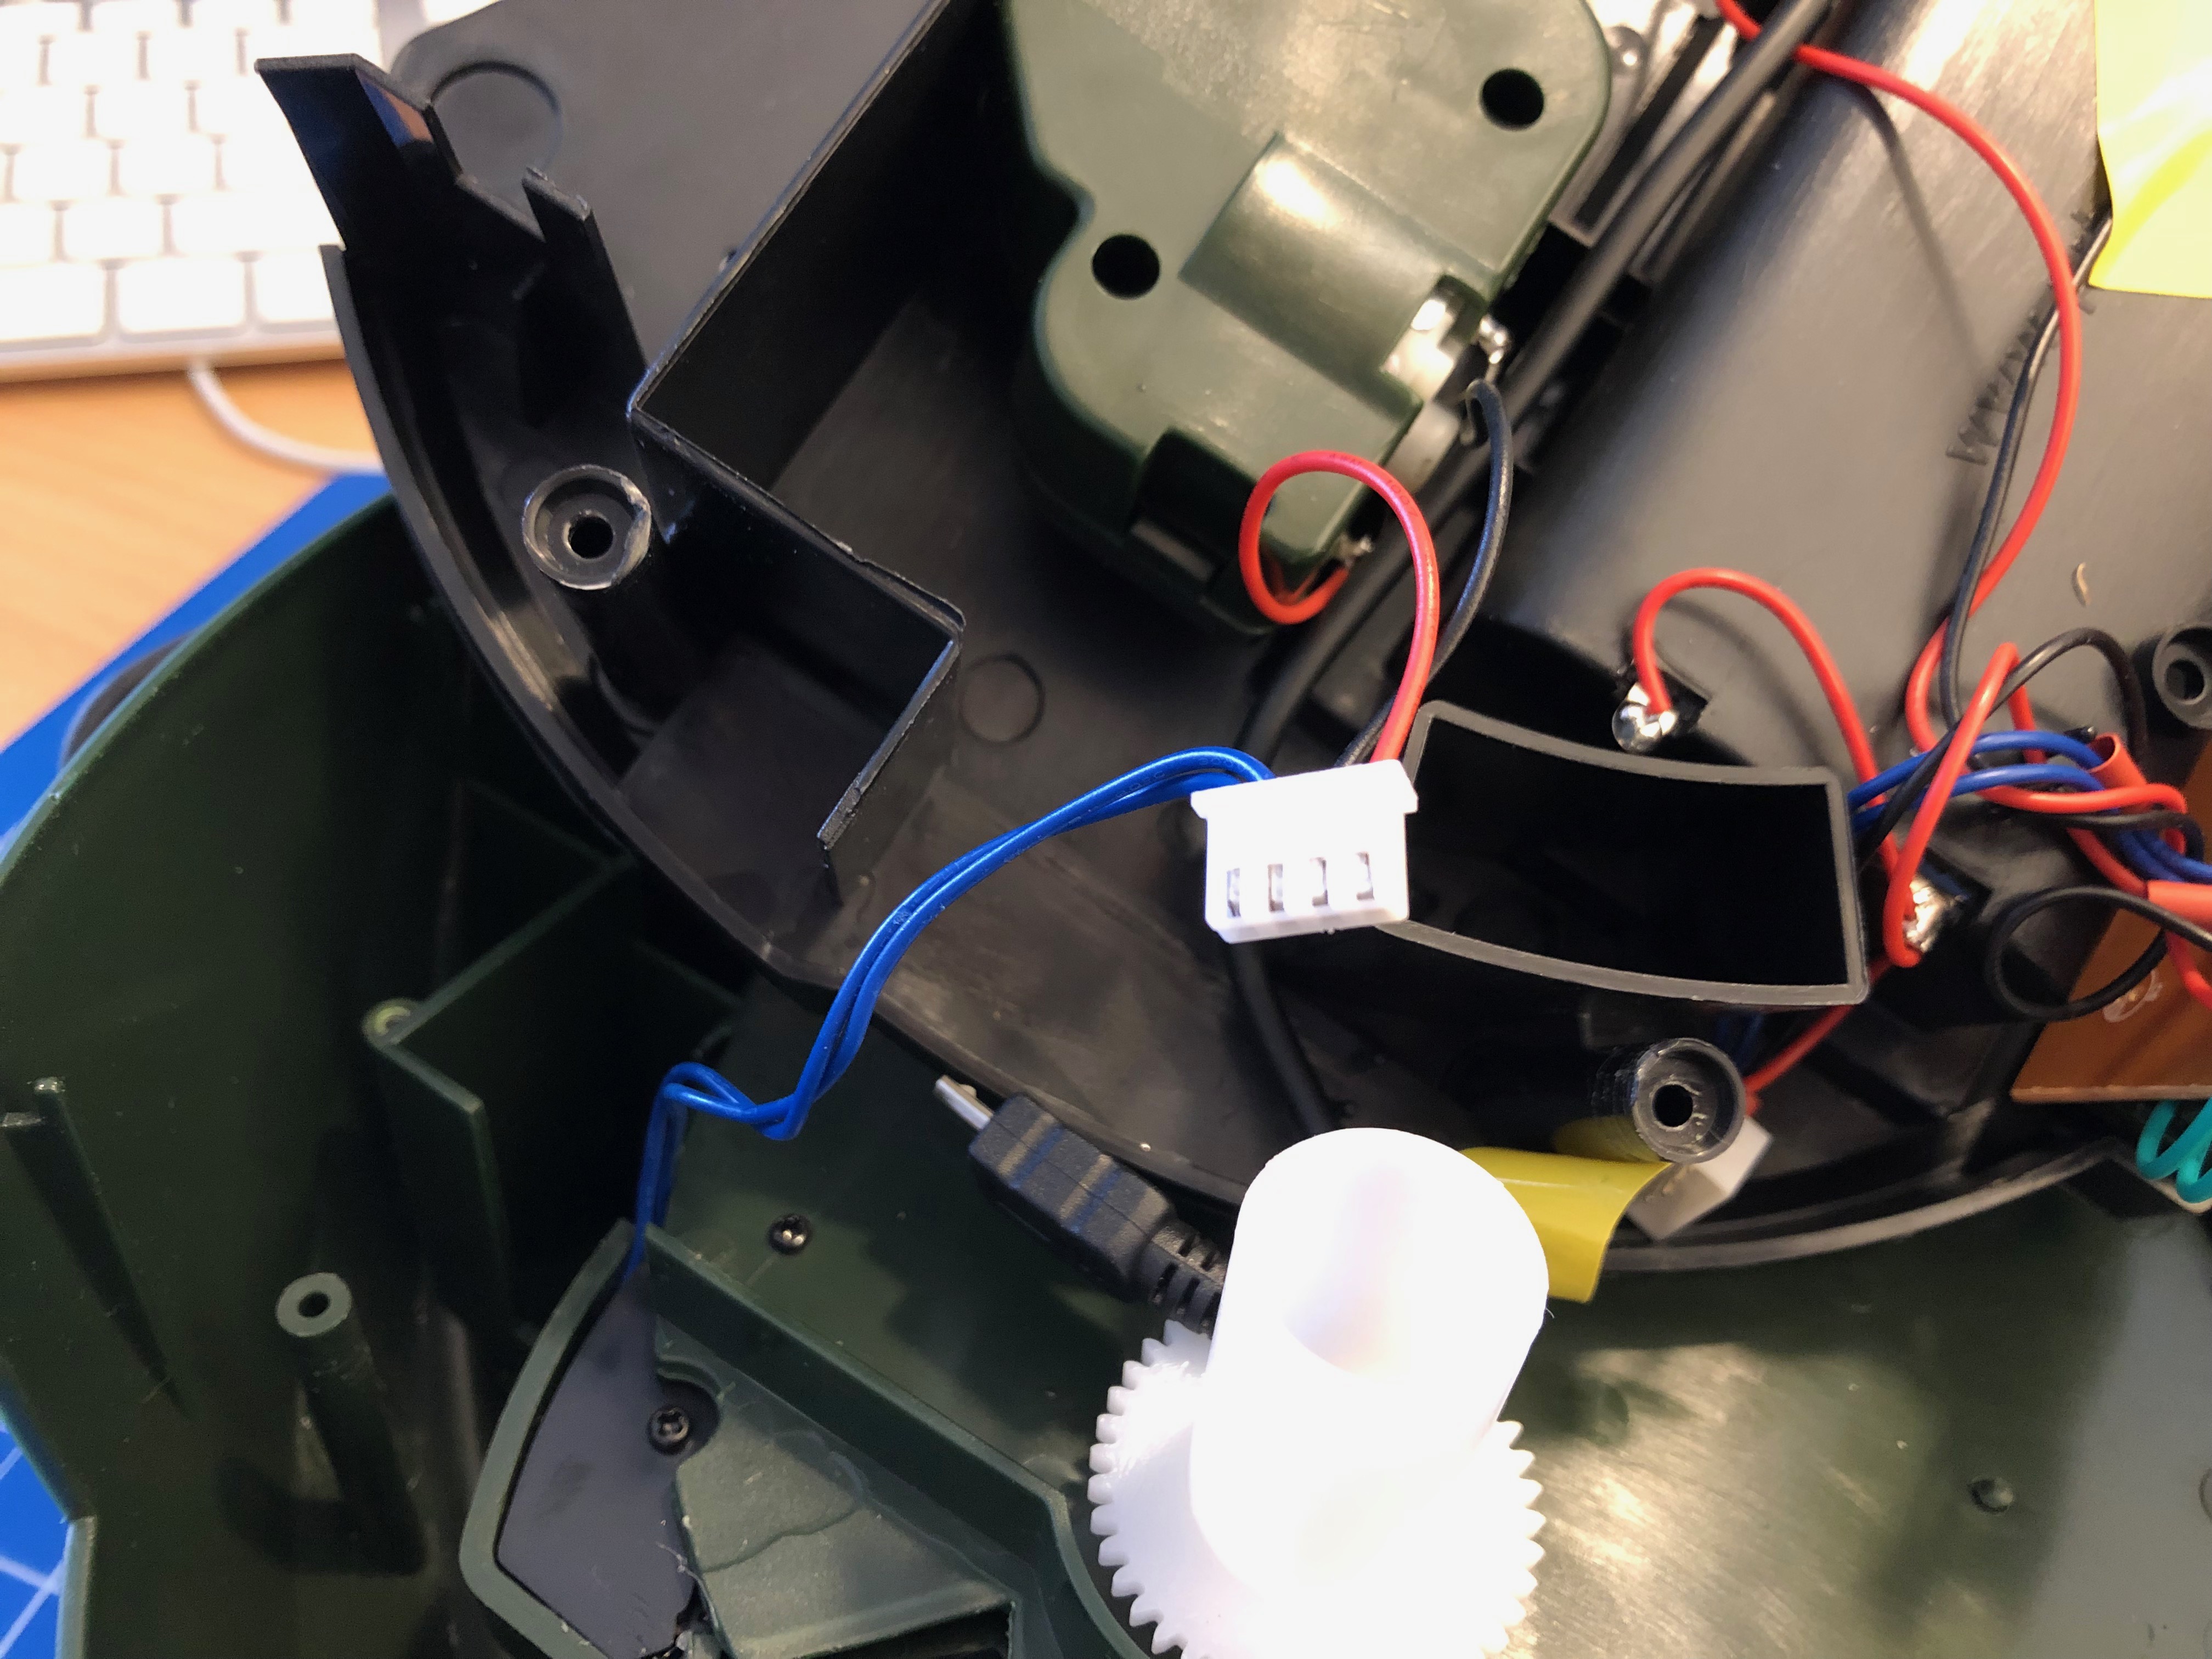
the wheel is turned by a DC motor and the switch is triggered by the wheels fins
I’ve added a connector to the switch and the motor cables for quick connect
The functional principle of the feeder is rather simple:
turn the feeder wheel
take the micro-switch status in account – when it’s pressed down the wheel must be pushing against it
turn it until the micro-switch is not pressed anymore
turn some more until it’s pressed again
Simple. Since the switch-status is not known on power loss / reboot a calibration run is necessary (even with the factory electronics) every time it boots up.
After opening the feeder I’ve cut the two cables going to the motor as well as the micro-switch cables. I’ve added a 4-Pin JST-XH connector to both ends. So I can reconnect it to original state if desired.
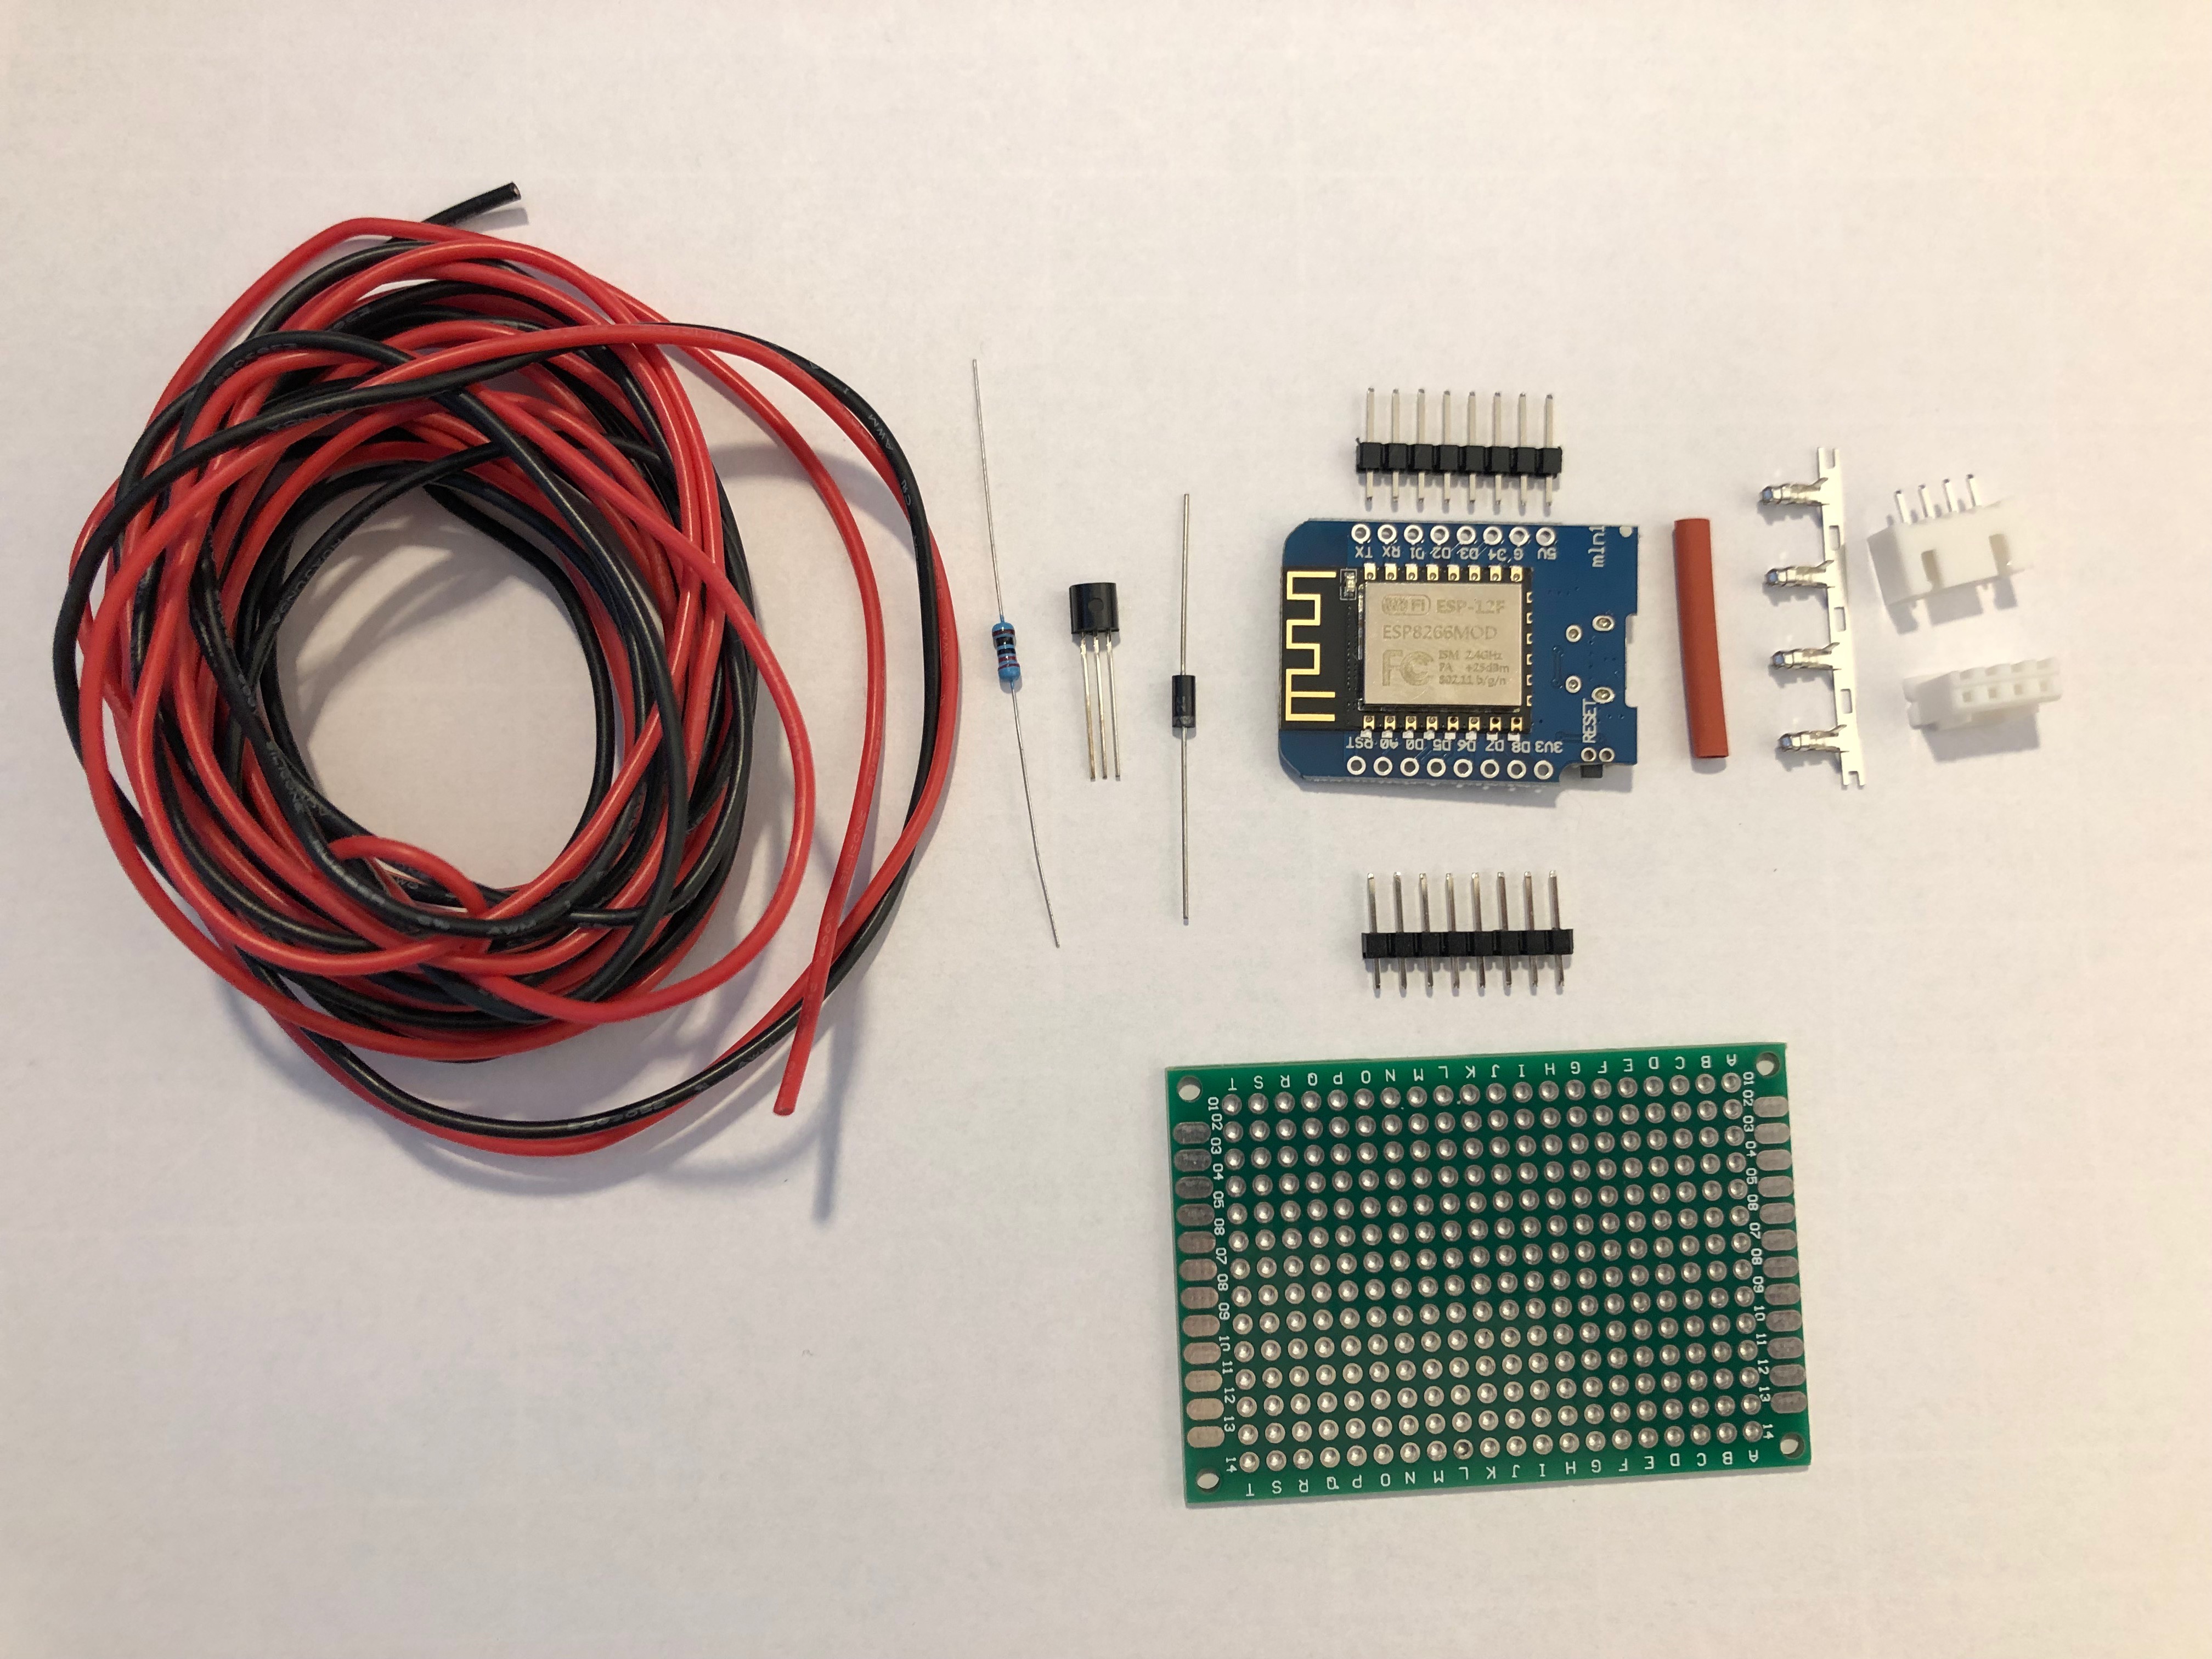
These are all the parts needed:
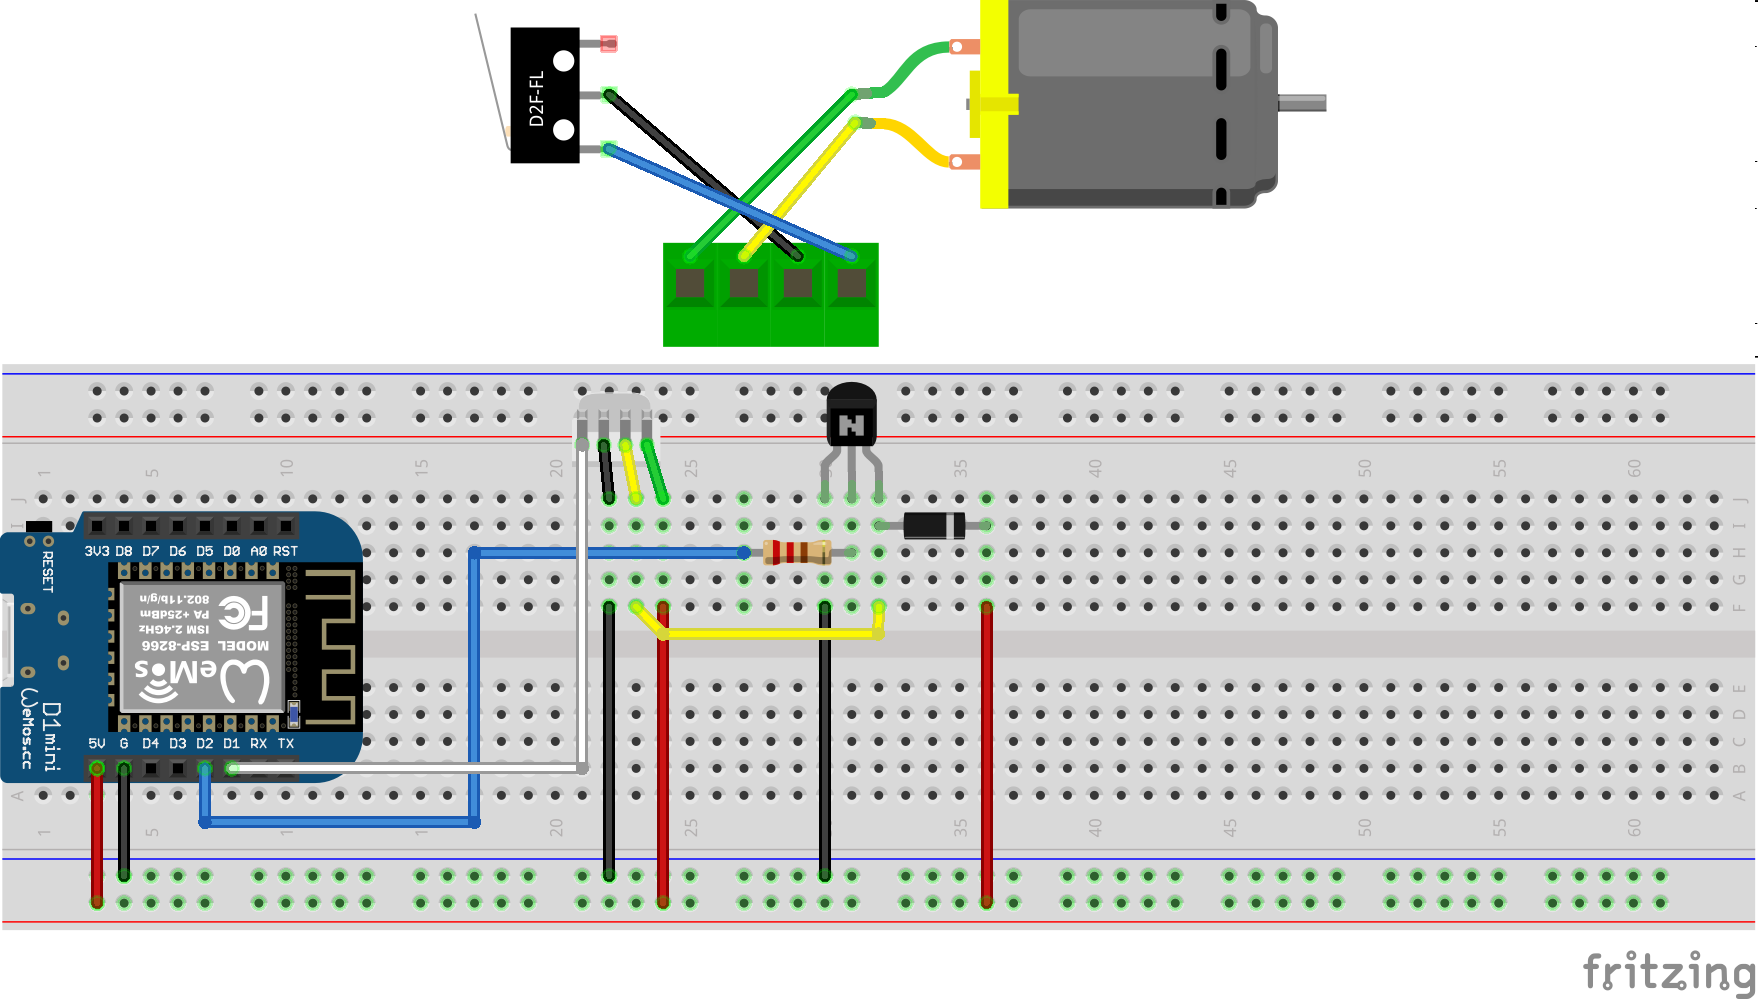
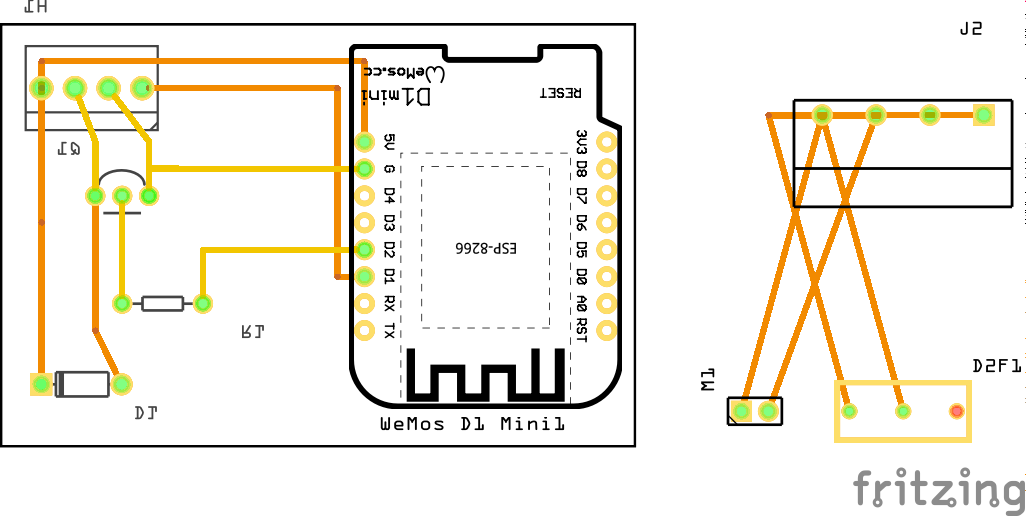
I am using a Wemos D1 Mini and a couple of additional components apart from the prototype board:
A PN2222 NPN transistor, a rectifier diode 1N4007 and a 220 Ohm resistor.
I’ve connected everything according to this schematic I’ve drawn with Fritzing:
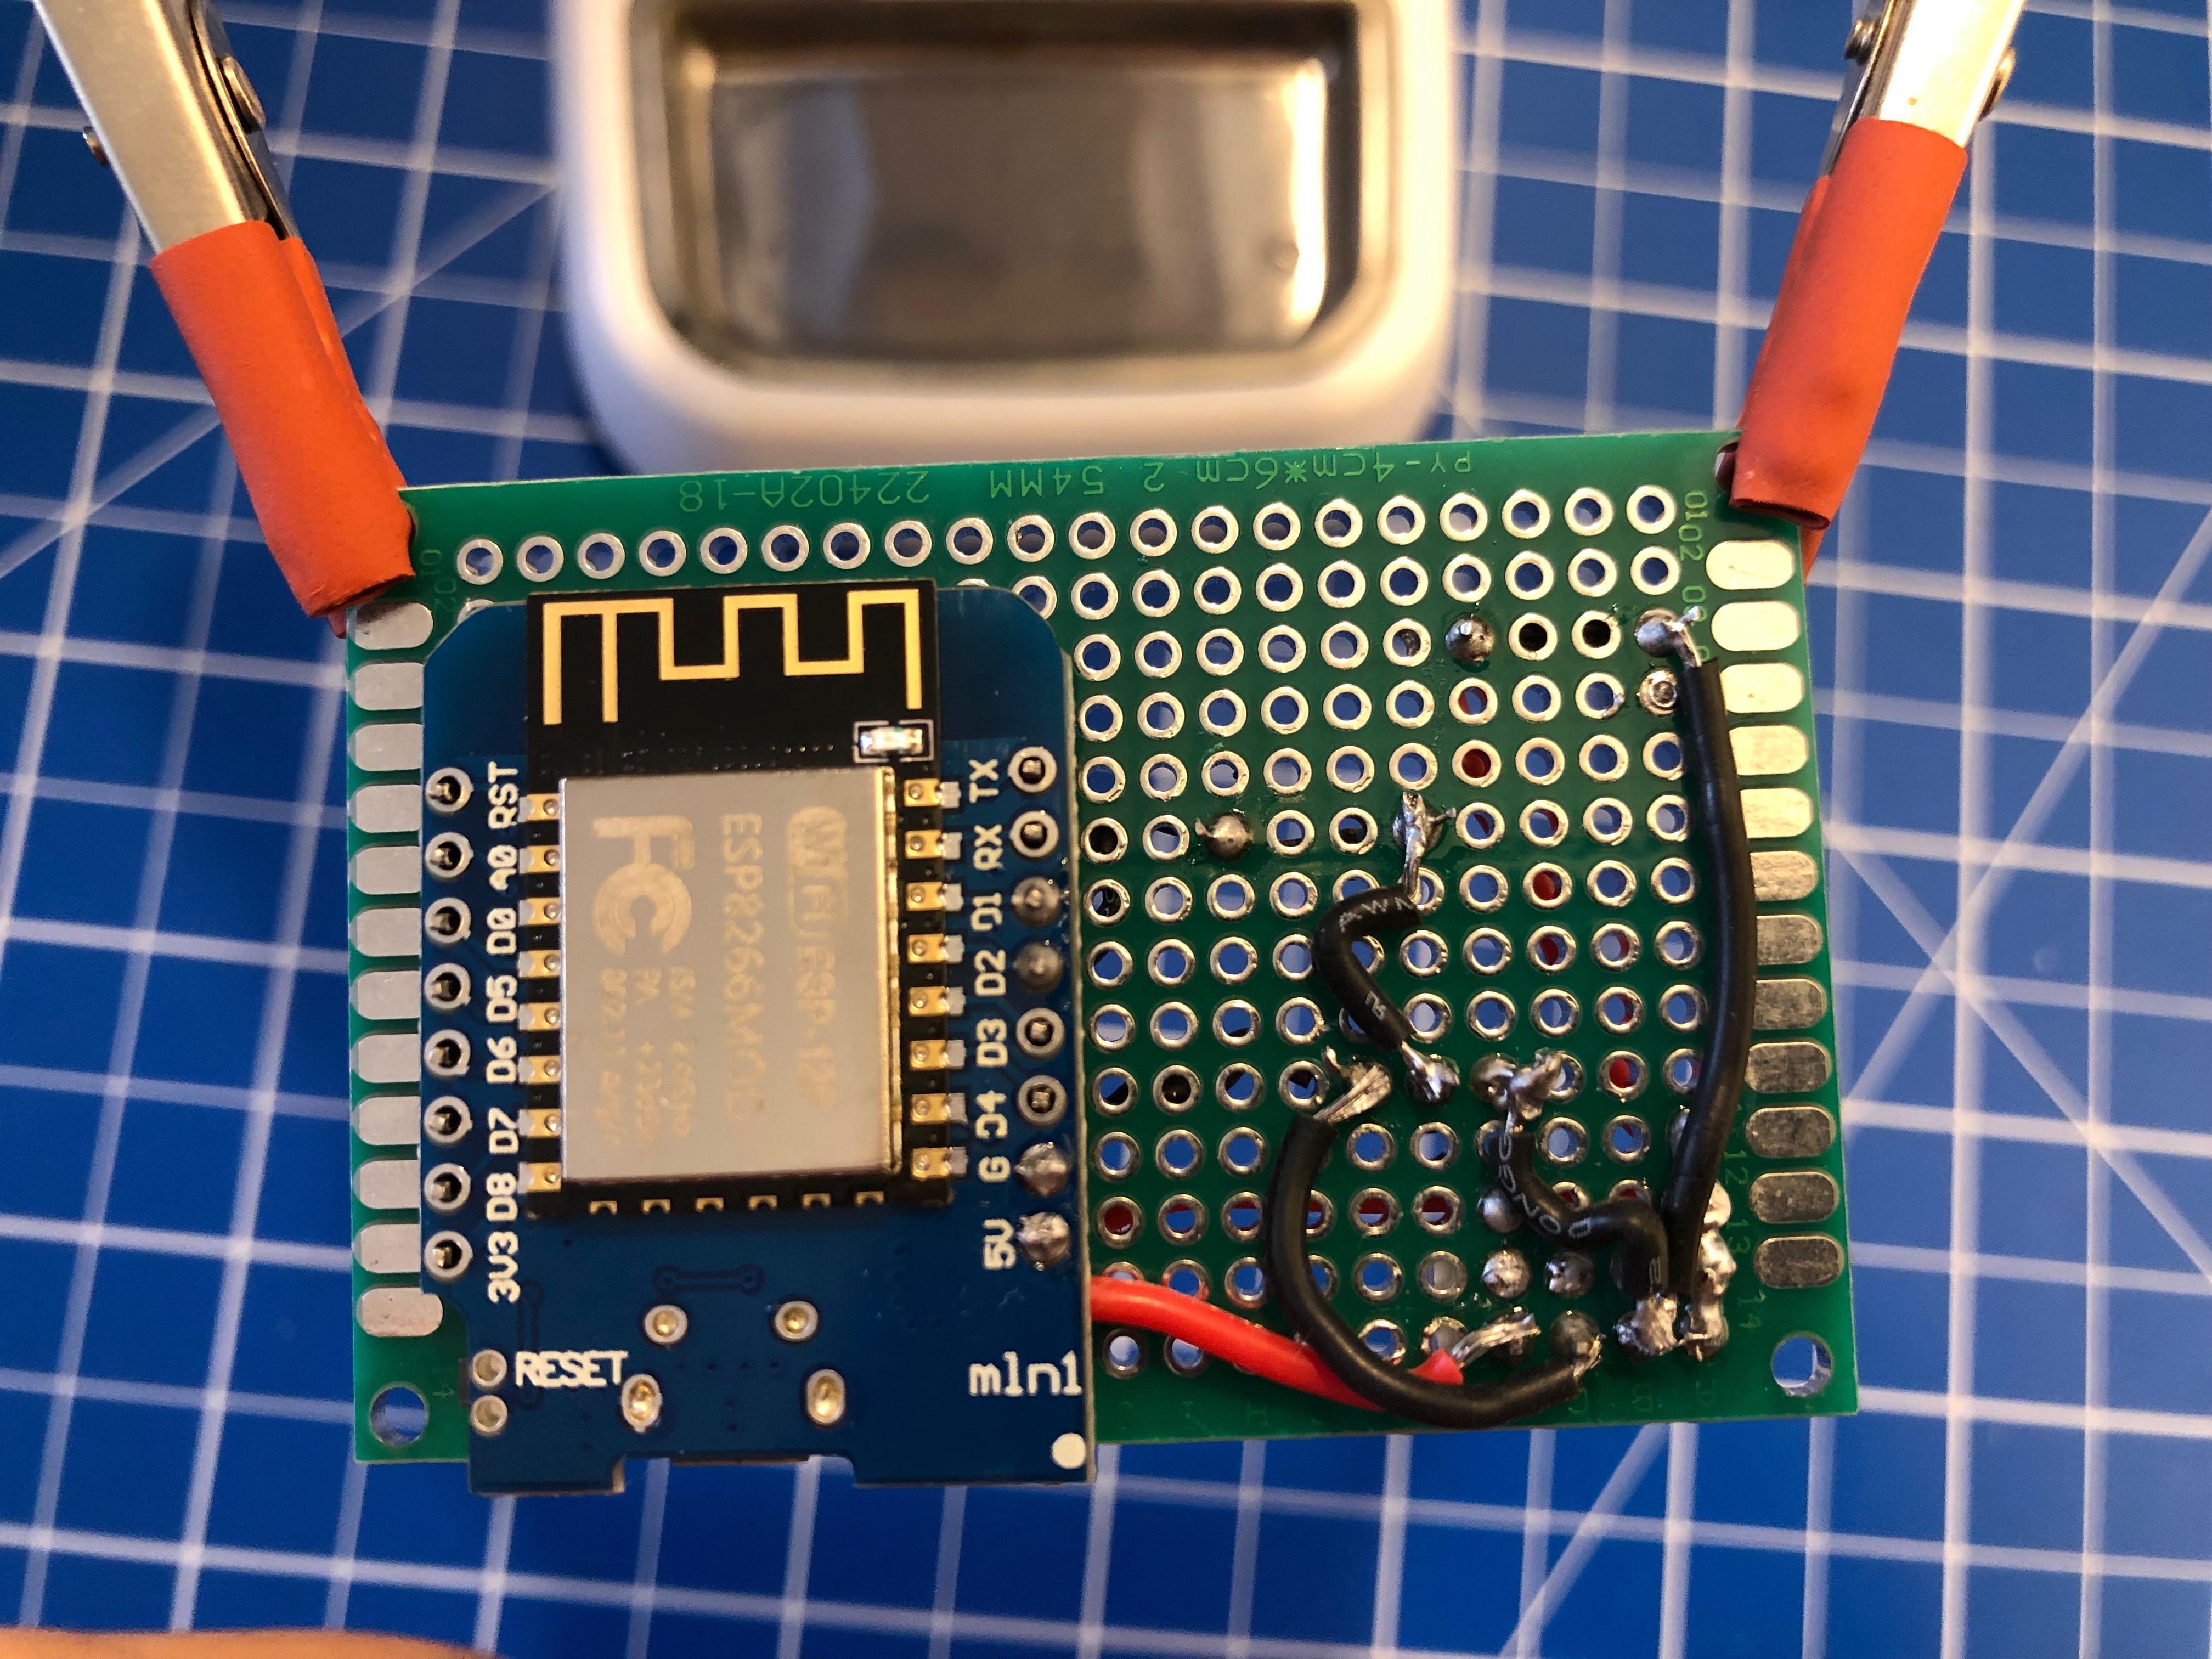
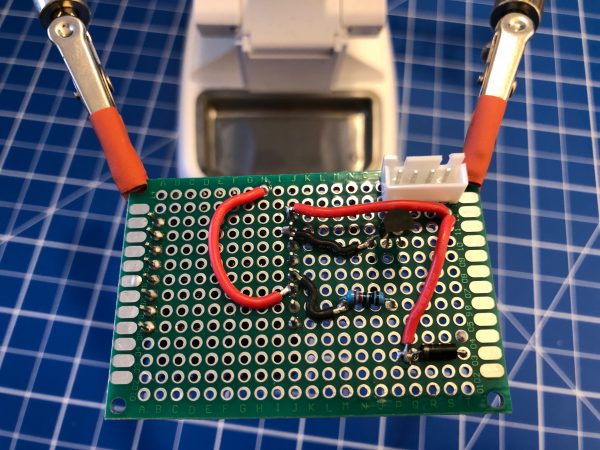
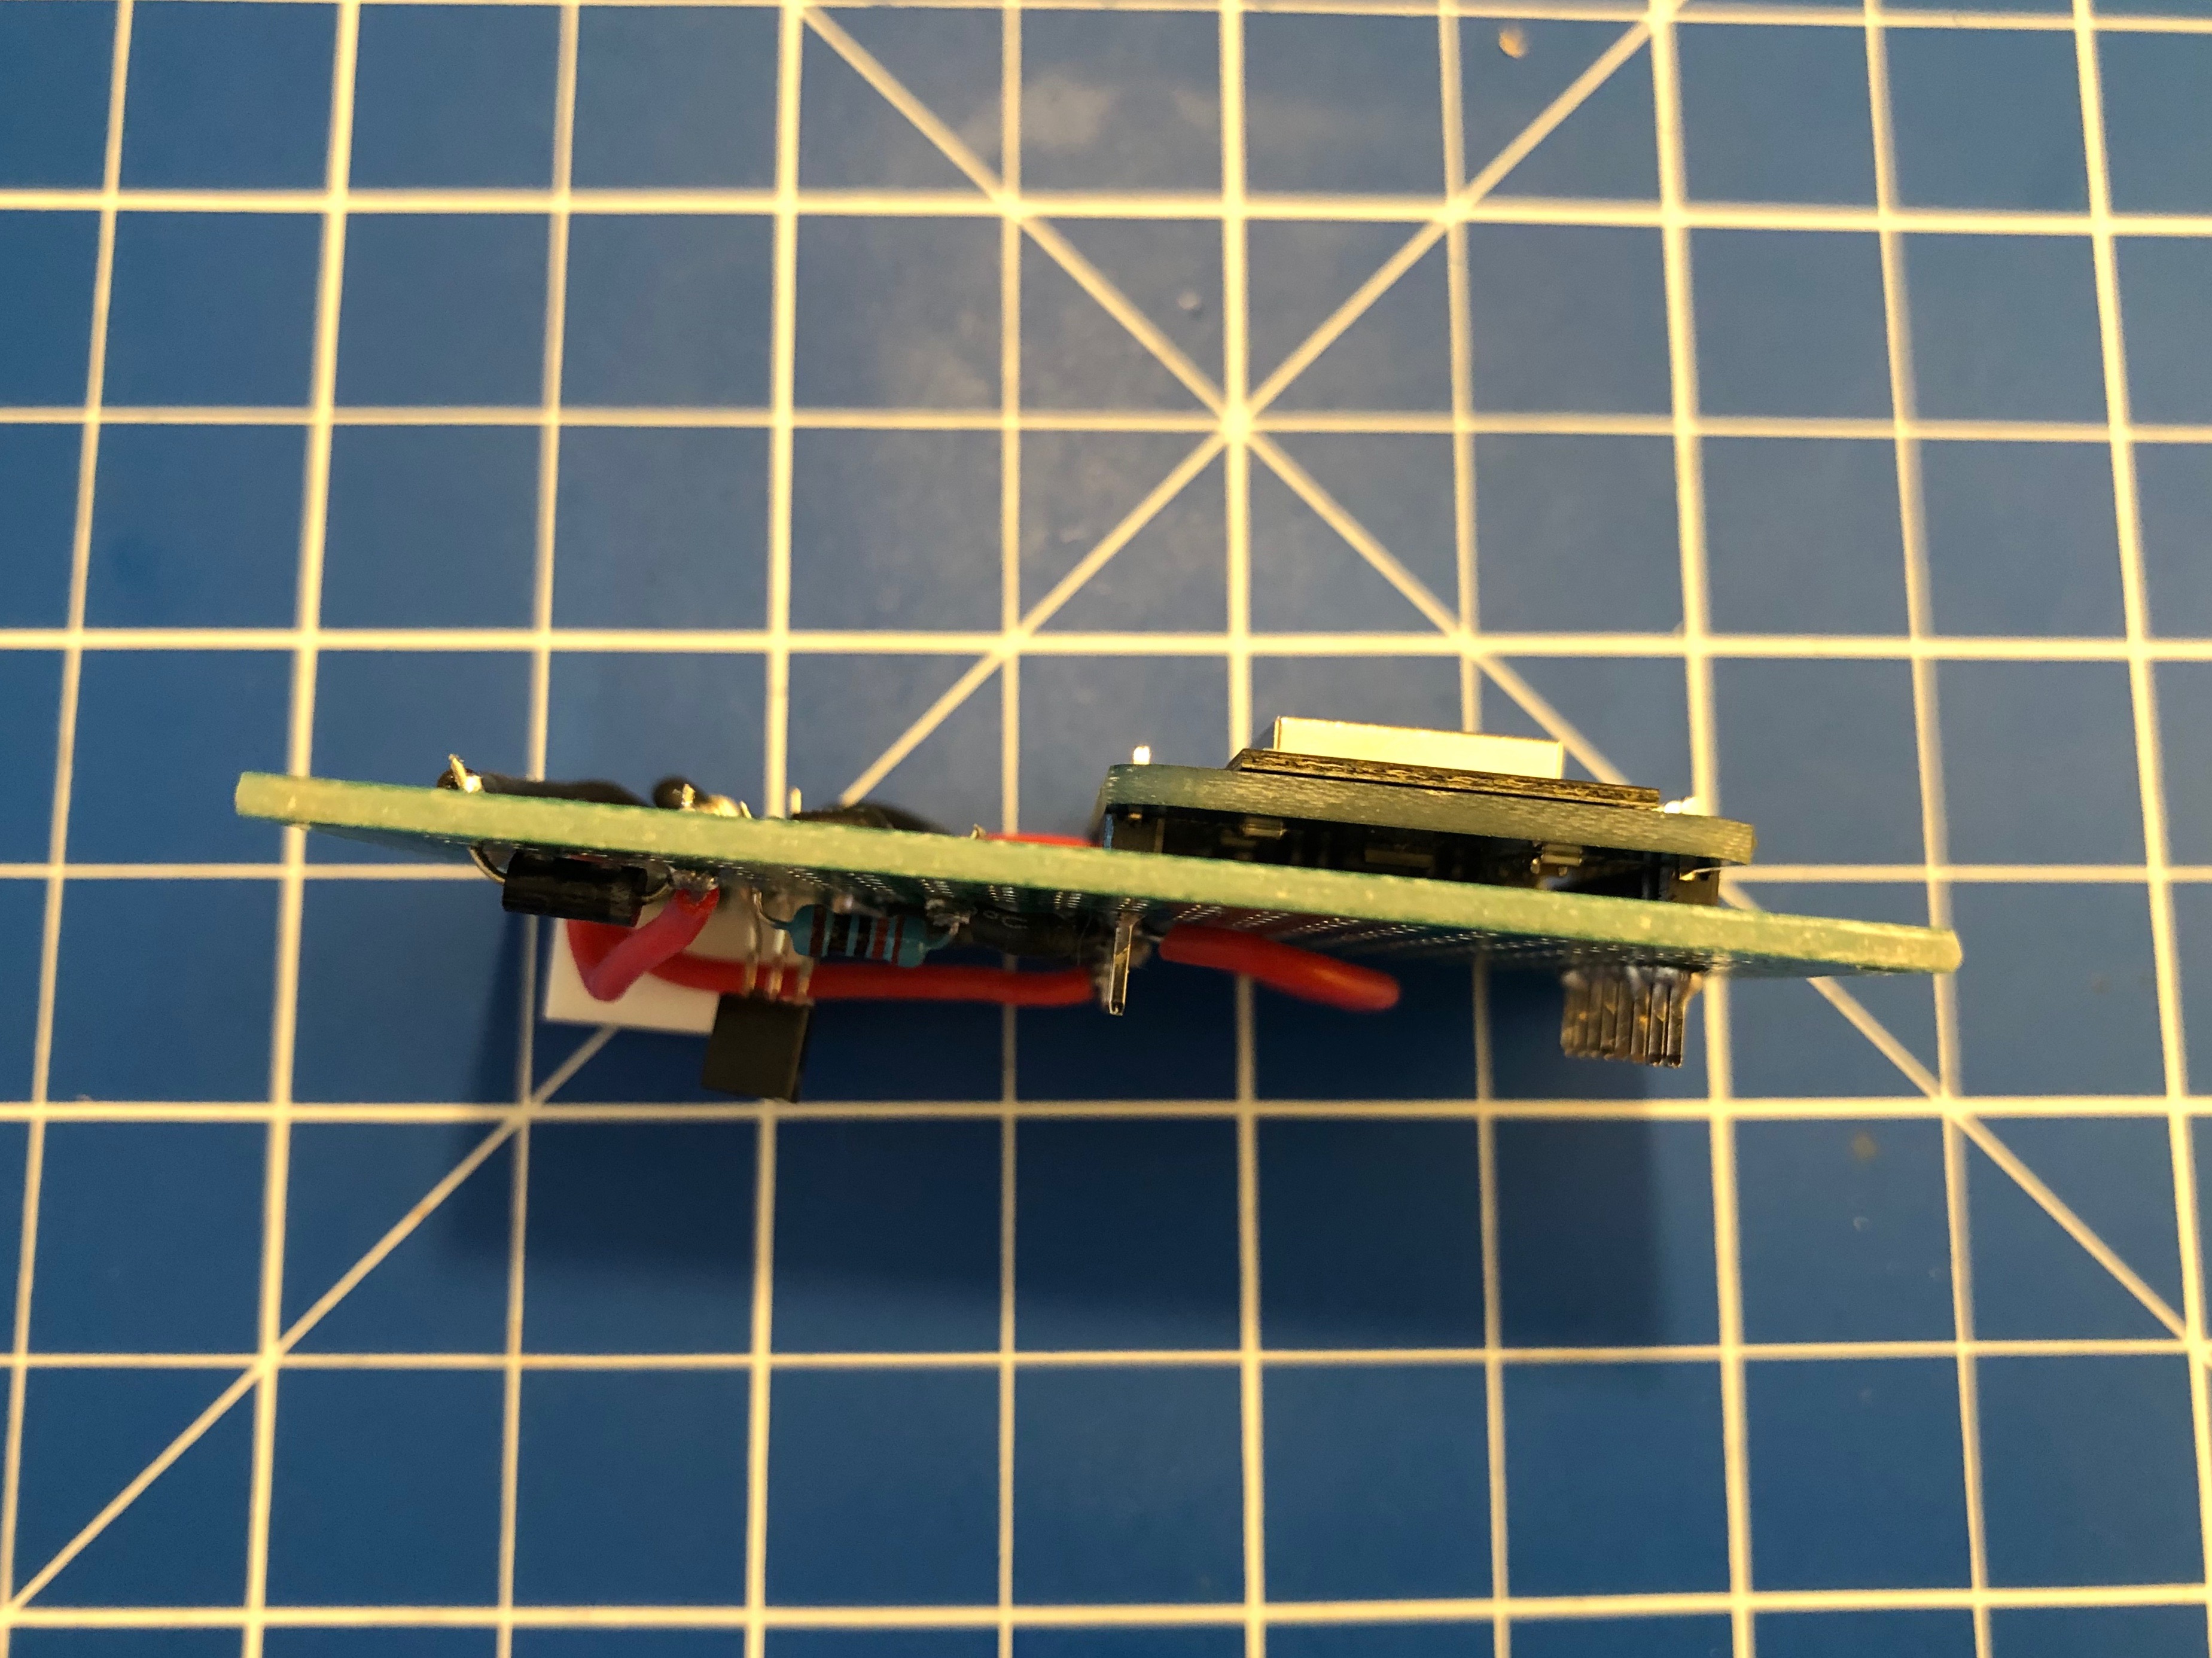
I’ve then prototyped away and put everything on the PCB. Of course with very limited solderig skill:
As you can see the JST-XH connector on Motor+Switch can now be connected easily to the PCB with all the parts.
Make sure you check polarity and that you did correctly hook up the motor and switch.
When done correctly the PCB (I’ve used 40mm x 60mm prototype pcb) and all cables will fit into the case. There’s plenty of room and I’ve put it to the side of it. I’ve also directly connected an USB cable to the USB port of the Wemos D1 Mini. As long as you put at least 1A into it it will all work.
Software
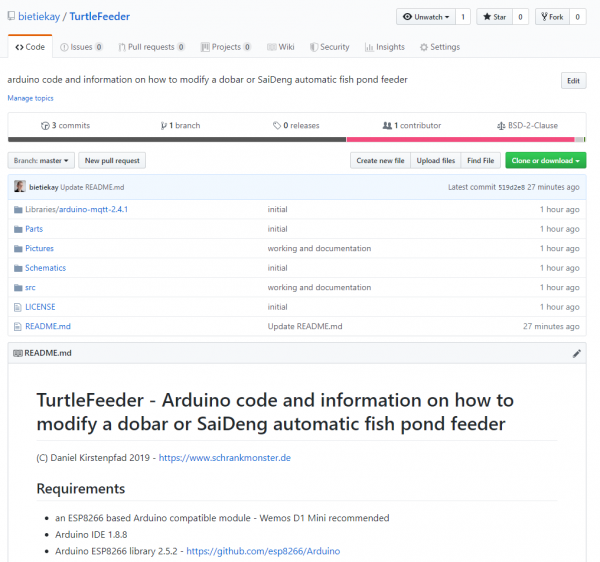
Since the Wemos D1 Mini sports an ESP8266 and is well supported by Arduino it was clear to me to use Arduino IDE for the software portion of this project.
To get everything running you need to modify the .ino file in the src folder like so:
Configuration
What you need to configure:
the output pins you have chosen – D1+D2 are pre-configured
WiFi SSID + PASS
MQTT Server (IP(+Username+PW))
MQTT Topic prefix
Commands that can be sent through mqtt to the /feed topic.
MQTT topics and control
There are overall two MQTT topics:
$prefix/feeder-$chipid/state This topic will hold the current state of the feeder. It will show a number starting from 0 up. When the feeder is ready it will be 0. When it’s currently feeding it will be 1 and up – counting down for every successfull turn done. There is an safety cut-off for the motor. If the motor is longer active than configured in the MaximumMotorRuntime variable it will shut-off by itself and set the state to -1.
$prefix/feeder-$chipid/feed This topic acts as the command topic to start / control the feeding process. If you want to start the process you would send the number of turns you want to happen. So 1 to 5 seems reasonable. The feeder will show the progress in the /state topic. You can update the amount any time to shorten / lengthen the process. On the very first feed request after initial power-up / reboot the feeder will do a calibration run. This is to make sure that all the wheels are in the right position to work flawlessly.
All in all there are 3 of these going to be running in our household and the feeding is going to be controlled either by Alexa voice commands or through Node-Red automation.
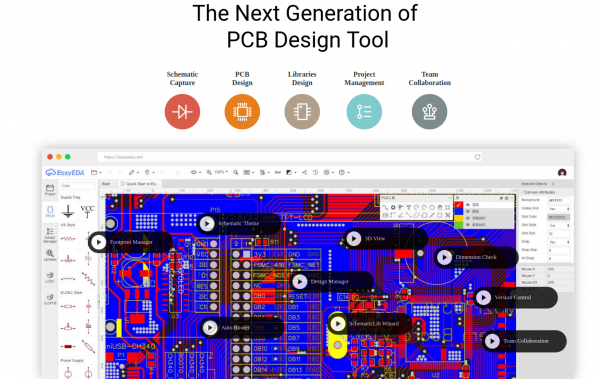
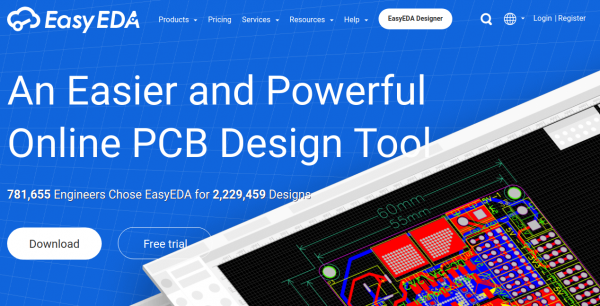
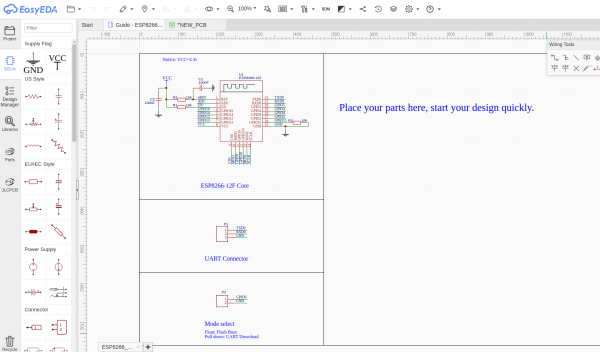
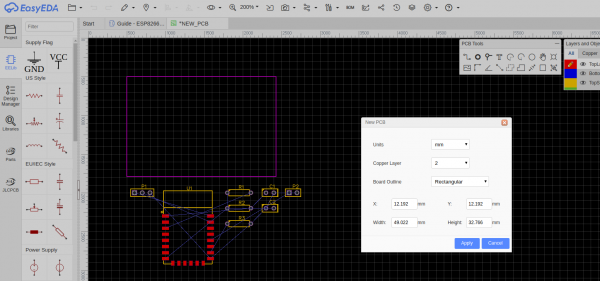
Maybe you want to give EasyEDA a try as it’s in-browser experience is better than anything I had come across so far. Granted I am not doing PCBs regularly but nevertheless – whenever I tried with the programs I’ve got recommended it wasn’t as straight forward as it is with this tool.
As people around me discuss what to go for in regards to manage their growing number of private GIT repositories I joined their discussion.
A couple of years ago I assessed how I would want to store my collection of almost 100 GIT private repositories and all those cloned mirrors I want to keep for archival and sentimental reasons.
An option was to pay for GitHub. Another option, which most seemed to prefer, was going for a local Gitlab set-up.
All seemed not desirable. Like chaining my workflows to GitHub as a provider or adopting a new hobby to operate and maintain a private GitLab server. And as it might have become easier to operate a GitLab server with the introduction of container management systems. But I’ve always seemed to have to update to a new version when I actually wanted to use it.
So this was when I had to make the call for my own set-up about 4 years ago. We were using a rather well working GitLab set-up for work back then. But it all seemed overkill to me also back then.
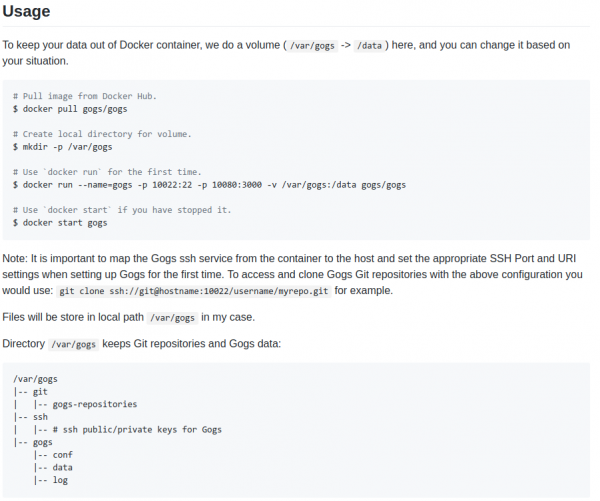
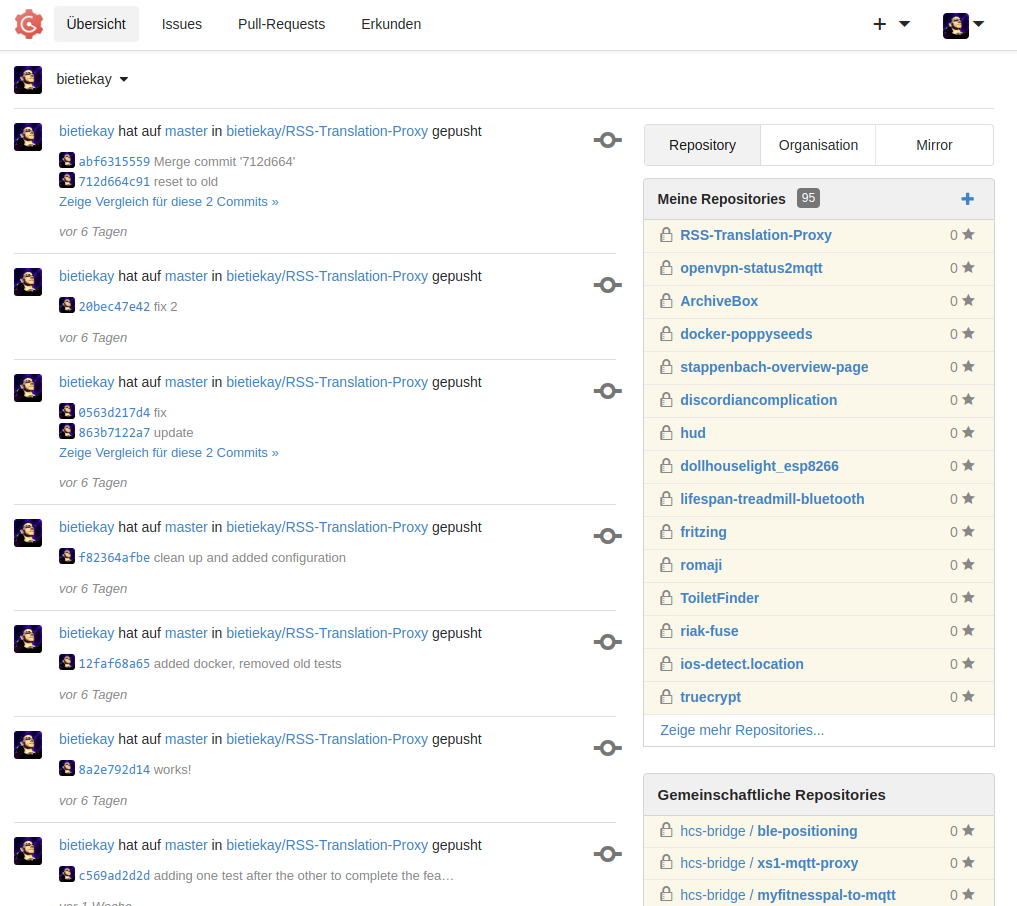
It runs with one command, the only dependency is two file system directories with (a) the settings of gogs and (b) your repositories.
It’ll deploy as literally a SINGLE BINARY without any other things to consider. With the provided dockerfile you are up and running in seconds.
It has never let me down. It’s running and providing it’s service. And that’s the end of it.
I am using it, as said, for 95 private repositories and a lot of additionally mirrored GIT repositories. Gogs will support you by keeping those mirrors in sync for you in the background. It’s even multi-user multi-organization.
Let me introduce you to a wonderful concept. We are using these movies as backdrop when on the stepper or spinning, essentially when doing sports or as a screensaver that plays whenever nothing else is playing on the screens around the house.
What is it you ask?
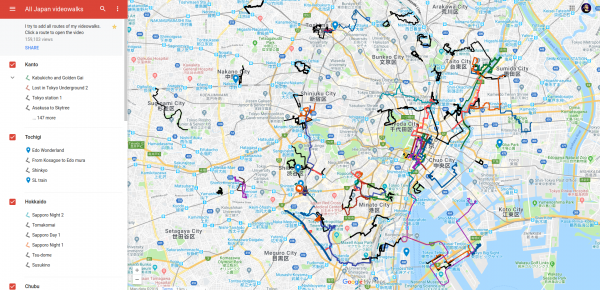
The thing I am talking about is: Walking Videos! Especially from people who walk through Tokyo / Japan. And there are lots of them!
Think of it as a relaxing walk around a neighborhood you might not know. Take in the sounds and sights and enjoy. That’s the idea of it.
If you want the immediate experience, try this:
Of course there are a couple of different such YouTube channels waiting for your subscription. The most prominent ones I know are:
Whenever we arrive at a place that we have not been before it is important to get properly connected to the internet.
Finding wifi SSIDs and typing passwords is tedious and prone to errors. There is an easier way of course!
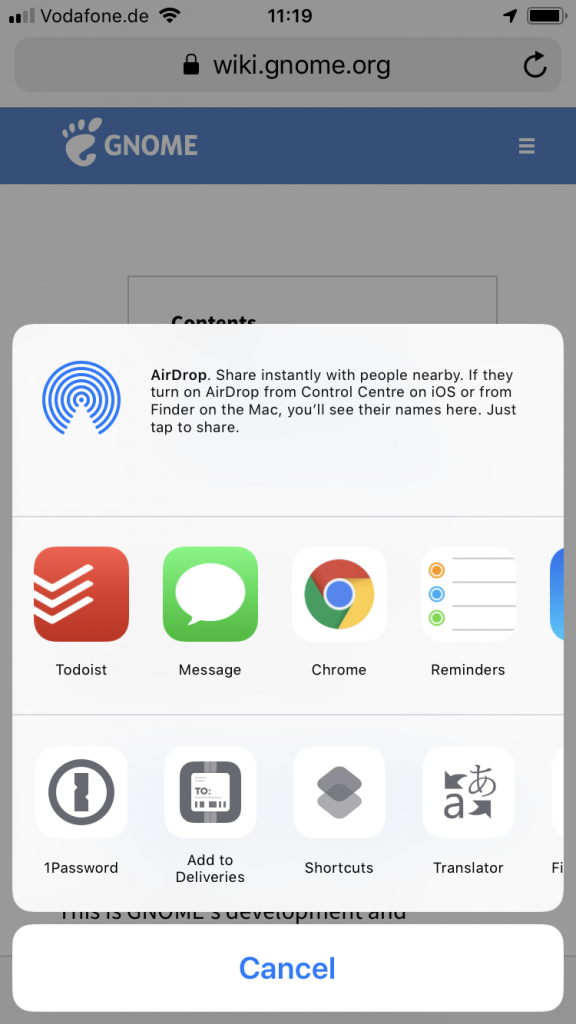
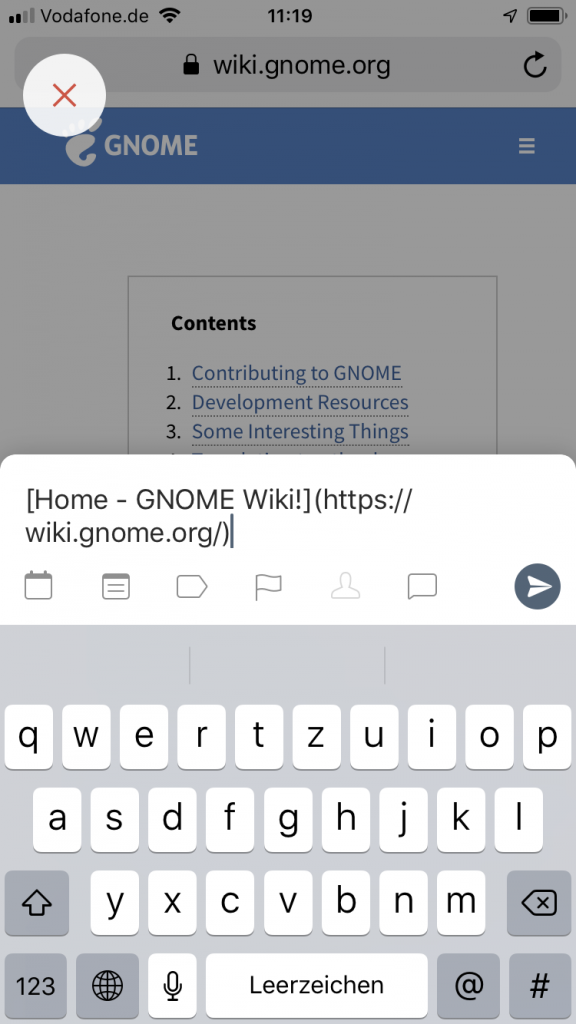
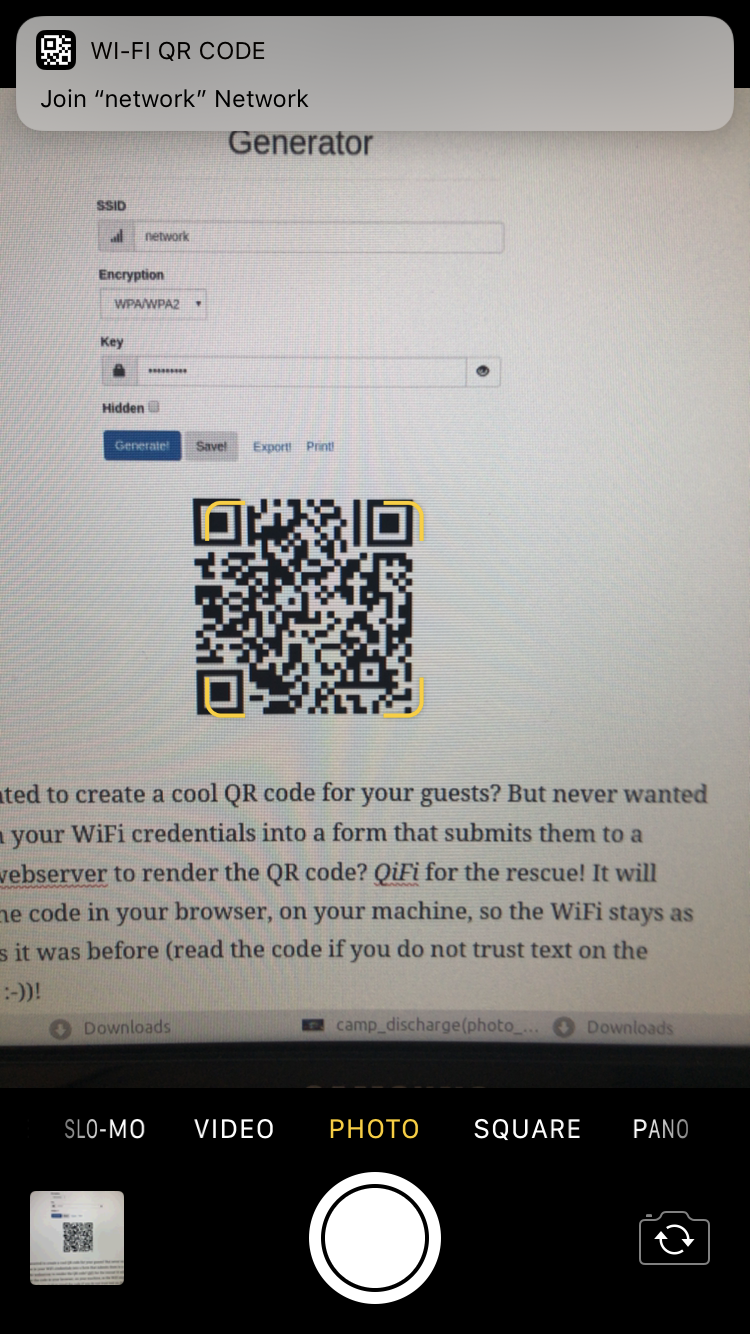
The owner of the wireless network can generate a QR code that you can easily take a photo of and your phone will automatically prompt you to log into the wireless network without you having to type anything.
On your phone it looks like this:
To generate these QR codes that contain all information for visitors/new users to connect this simple tool / online generator can be used:
Ever wanted to create a cool QR code for your guests? But never wanted to type in your WiFi credentials into a form that submits them to a remote webserver to render the QR code? QiFi for the rescue! It will render the code in your browser, on your machine, so the WiFi stays as secure as it was before (read the code if you do not trust text on the internet :-))!
Don’t worry: your access point information is not transferred over the internet. As this is open source at the time of writing the data was held in HTML 5 local storage on the local browser only and not transferred out.
For big parts of my VPN needs I use OpenVPN. Especially on iOS devices the deep integration just works. Even to a degree that you enable the VPN once and the device will transparently keep it up / reestablish connections when required.
OpenVPN protocol has emerged to establish itself as a de- facto standard in the open source networking space with over 50 million downloads. OpenVPN is entirely a community-supported OSS project which uses the GPL license.
I am using the dockerized version of OpenVPN. From there I’ve got several ways to get telemetry data (like connections, traffic, …) out of it. One way is the management interface provided by OpenVPN. Another way is by using the default openvpn-status.log file.
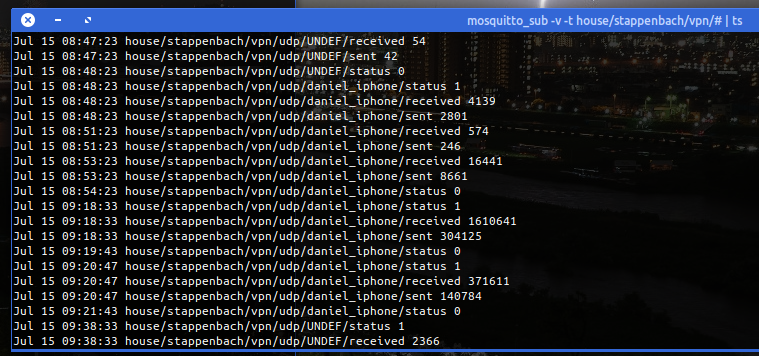
Since the easiest way out-of-the-box was to use the logfile I sat down and wrote a little 2mqtt bridge for the contents of the logfile.
It’s also dockerized so you can easily set it up by pointing the openvpn-status.log to the right volume/mount-point.
When done it’ll produce MQTT messages like this:
The set-up and start-up is rather simple:
docker run -d --restart=always --volume /openvpnstatus2mqttconfiglocation/:/configuration --volume /openvpnstatusloglocation/:/openvpn openvpn-status2mqtt
MQTT Broker, Topic-Prefix and so on are configured with the .json configuration file found along the project.
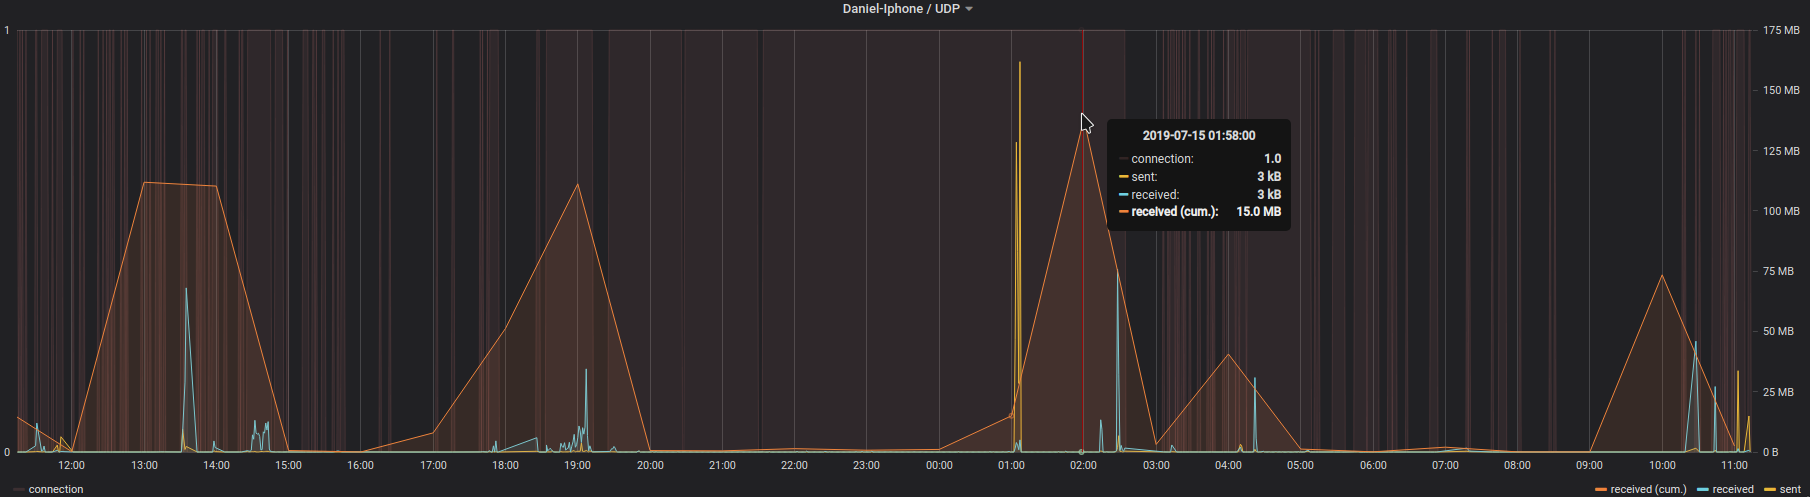
The immediate outcome of this is that with the always-on VPN I am now getting statistics about, for example, the data consumption of my iPhone.
The big traffic spike at 1 AM is the backup that my iPhone does every night. Very interesting also how often the connection is closed and opened again even without me using the phone…
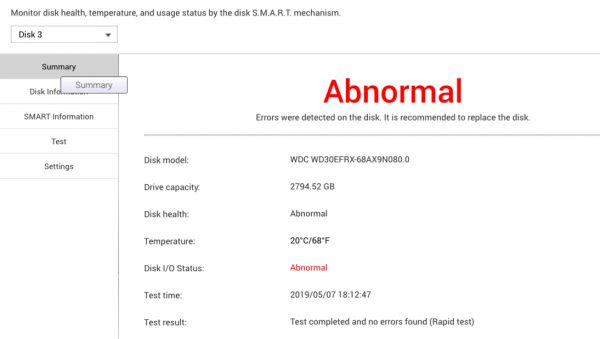
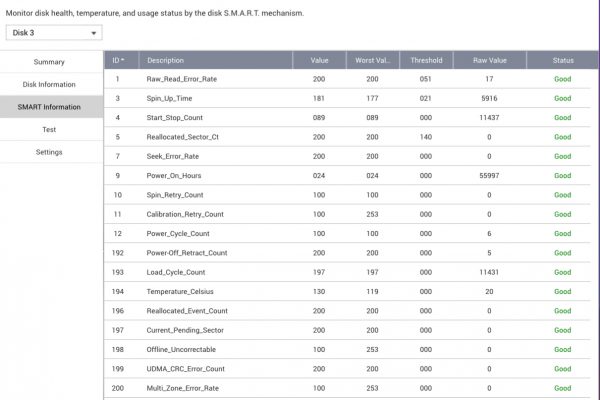
As the replacement drive for yesterdays hard drive crash was put into place the storage array started to re-silver the newly added empty drive. This process takes a while – about 8 hours for this particular type of array.
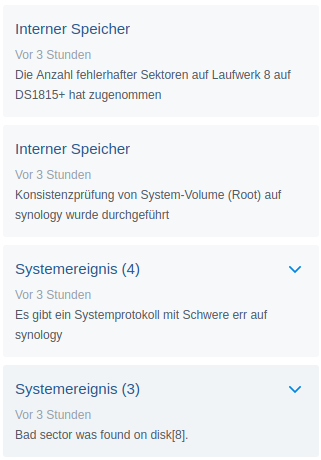
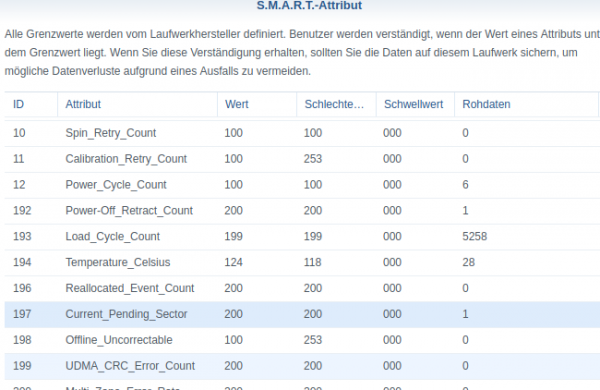
Interestingly just 2 minutes into the process another drive dropped a bombshell:
Apparently disk 8 holds together it’s business so far but dropped a couple of parity errors into the equation.
This is bad news. But so far science still is on my side of things and no data has been lost.
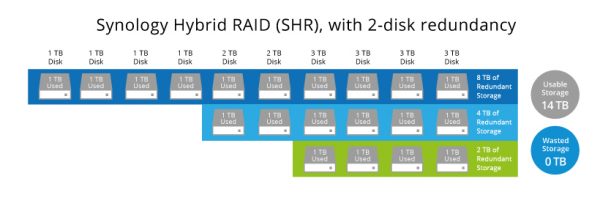
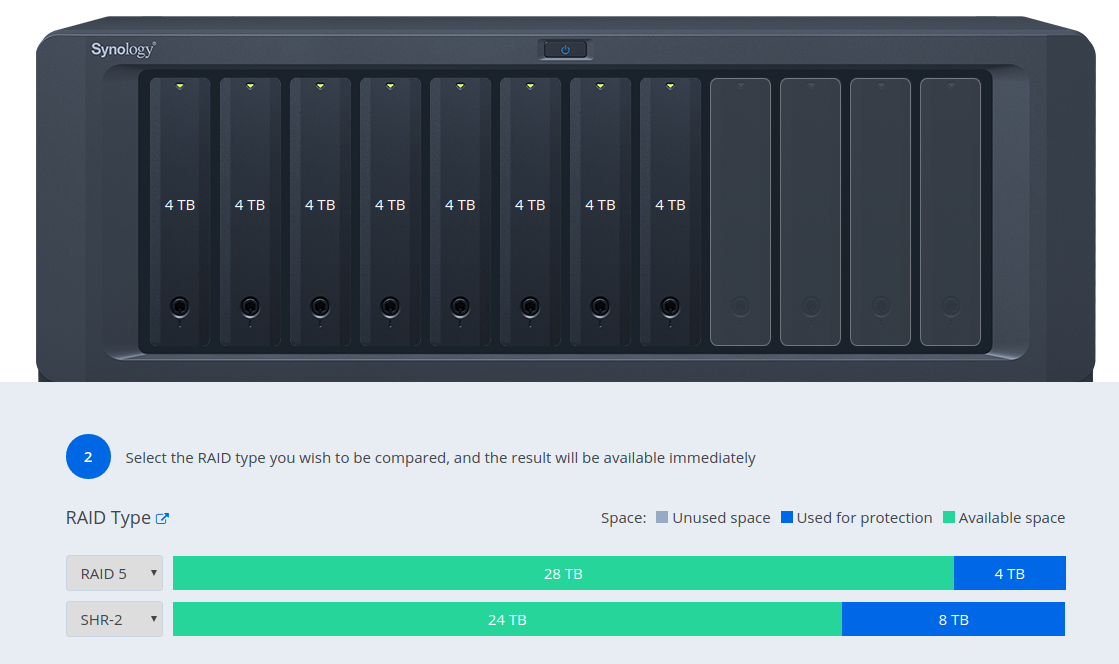
But now redundancy is down completely. There’s no redundancy for now – until the replaced hard disk is fully integrated. My policy for these sized drives demands a minimum of 2-disk redundancy and for today this policy saved the day (data).
Actually let’s dive a bit into what it’s doing there to achieve 2-disk redundancy:
Synology Hybrid RAID (SHR) is an automated RAID management system from Synology, designed to make storage volume deployment quick and easy. If you don’t know much about RAID, SHR is recommended to set up the storage volume on your Synology NAS.
You will learn different types of SHR and their advantages/disadvantages over classic single disk/RAID setups. In the end, you will be able to choose a type of RAID or SHR for the best interest of your storage volume. This article assumes that as the admin of your Synology NAS, you are also an experienced network administrator with a firm grasp of RAID management.
MyFitnessPal is a great online service we are using to track what we eat. It’s well integrated into our daily routine – it works!
Unfortunately MyFitnessPal is not well set-up to interface 3rd party applications with it. In fact it appears they are actively trying to make it harder for externals to utilize the data there.
To access your data there’s an open source project called “python-myfitnesspal” which allows you to interface with MyFitnessPal from the command line. This project uses web-scraping to extract the information from the website and will break everytime MyFitnessPal is changing the design/layout.
Since the output for this would be command line text output it is not of great use for a standardized system. What is needed is to have the data sent in a re-useable way into the automation system.
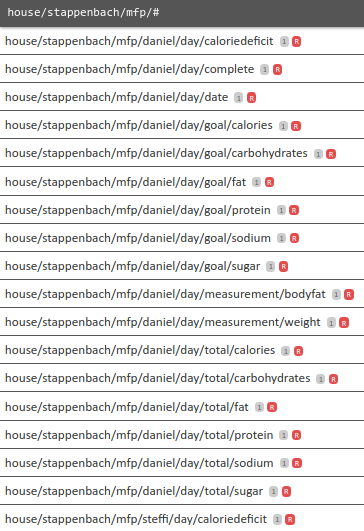
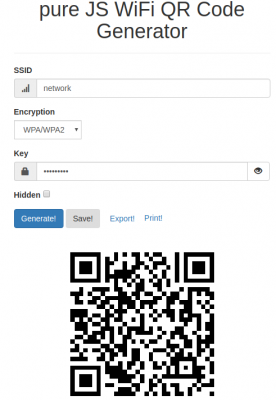
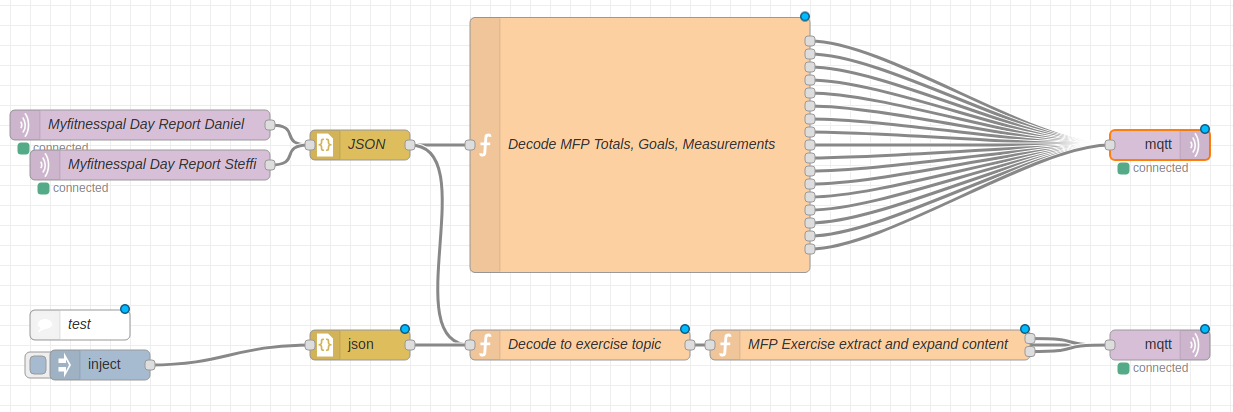
This is why I wrote the additional tool “myfitnesspal2mqtt“. It takes the output provided by python-myfitnesspal and sends it to an MQTT topic. The message then can be decoded, for example with NodeRed, and further processed.
As you can see in the image above I am taking the MQTT message coming from myfitnesspal2mqtt and decoding it with a bit of javascript and outputting it back to MQTT.
In the end it expands into a multitude of topics with one piece of information per MQTT topic.
And with just that every time the script is run (which I do in a docker container and with a cronjob) the whole lot of pieces of information about nutrition and health stats are being pushed and stored in the home automation system.
This way they are of course also available to the home automation system to do things with it.
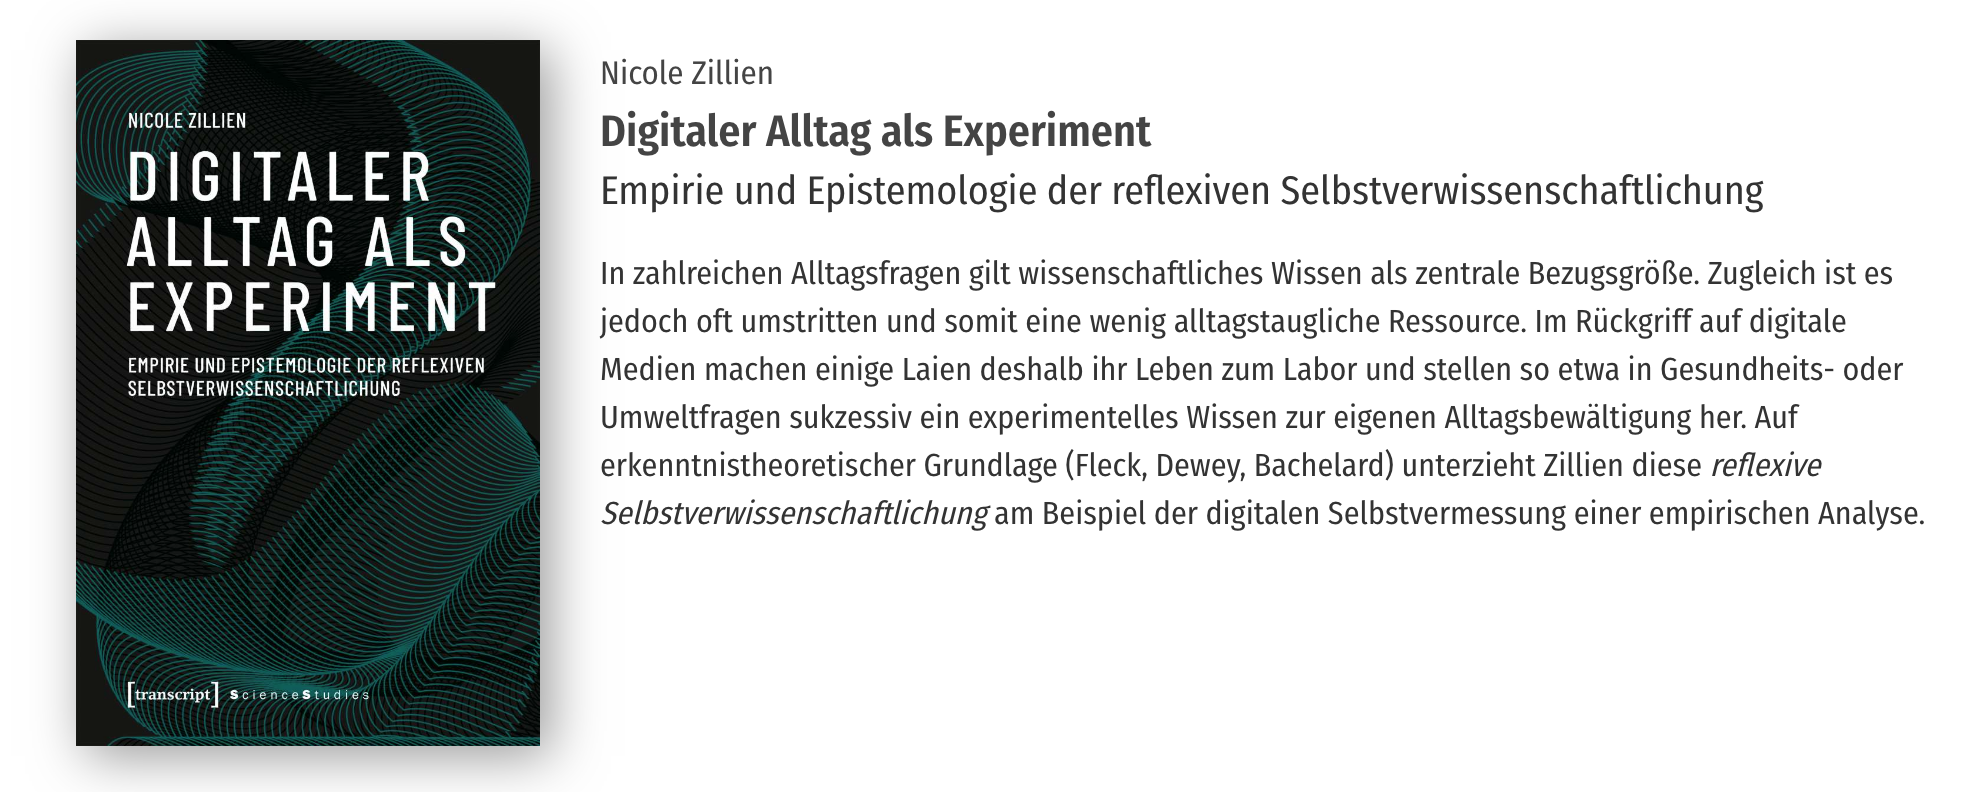
Last week we were approached by Prof. Dr. Nicole Zillien from Justus-Liebig-University in Gießen/Germany. She explained to us that she currently is working on a book.
In this book an empirical analysis is carried out on “quantified-self” approaches to real life problems.
With the lot of information and data we had posted on our personal website(s) like this blog and the “loosing weight” webpage apparently we qualified for being mentioned. We were asked if it would be okay to be named in the book or if we wanted to be pseudonymized.
Since everything we have posted online and which is publicly accessible right now can and should be quoted we were happy to give a go-ahead. We’re publishing things because we want it to spur further thoughts.
It will be out at the end of 2019 / beginning of 2020. As soon as it is out we hope to have a review copy to talk about it in this blog once again.
We do not know what exactly is being written and linked to us – we might as well end up as the worst example of all time. But well, then there’s something to learn in that as well.
In the interesting field of IoT a lot of buzz is made around the predictive maintenance use cases. What is predictive maintenance?
The main promise of predictive maintenance is to allow convenient scheduling of corrective maintenance, and to prevent unexpected equipment failures.
The key is “the right information in the right time”. By knowing which equipment needs maintenance, maintenance work can be better planned (spare parts, people, etc.) and what would have been “unplanned stops” are transformed to shorter and fewer “planned stops”, thus increasing plant availability. Other potential advantages include increased equipment lifetime, increased plant safety, fewer accidents with negative impact on environment, and optimized spare parts handling.
So in simpler terms: If you can predict that something will break you can repair it before it breaks. This improvse reliability and save costs, even though you repaired something that did not yet need repairs. At least you would be able to reduce inconveniences by repairing/maintaining when it still is easy to be done rather than under stress.
You would probably agree with me that these are a very industry-specific use cases. It’s easy to understand when it is tied to an actual case that happened.
Let me tell you a case that happened here last week. It happened to Leela – a 10 year old white British short hair lady cat with gorgeous blue eyes:
Ever since her sister had developed a severe kidney issue we started to unobtrusively monitor their behavior and vital signs. Simple things like weight, food intake, water intake, movement, regularities (how often x/y/z).
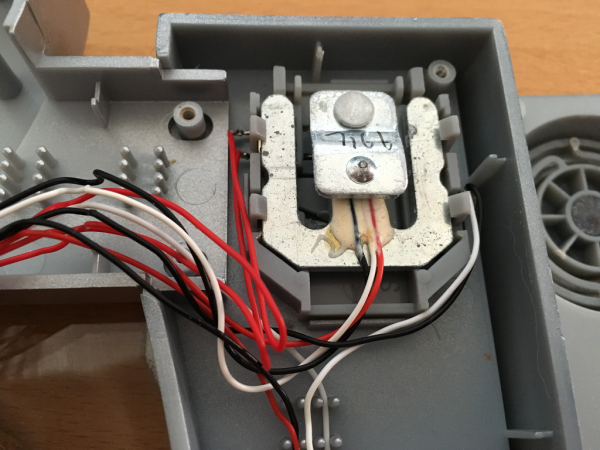
I’ve built hardware to allow us to do that in the most simple and automated way. In the case of getting to know their weight we would simply put the kitty litter box on a heavily modified persons scale. I wrote about that already back int 2016.
When Leela now visits her litter box she is automatically weighed and it’s taken note that she actually used it.
A lot of data is aggregated on this and a lot of things are being done to that data to generate indications of issues and alerts.
This alerted us last weekend that there could be an issue with Leelas health as she was suddenly visiting the litter box a lot more often across the day.
We did not notice anything with Leela. She behaved as she would everyday, but the monitoring did detect something was not right.
What had happened?
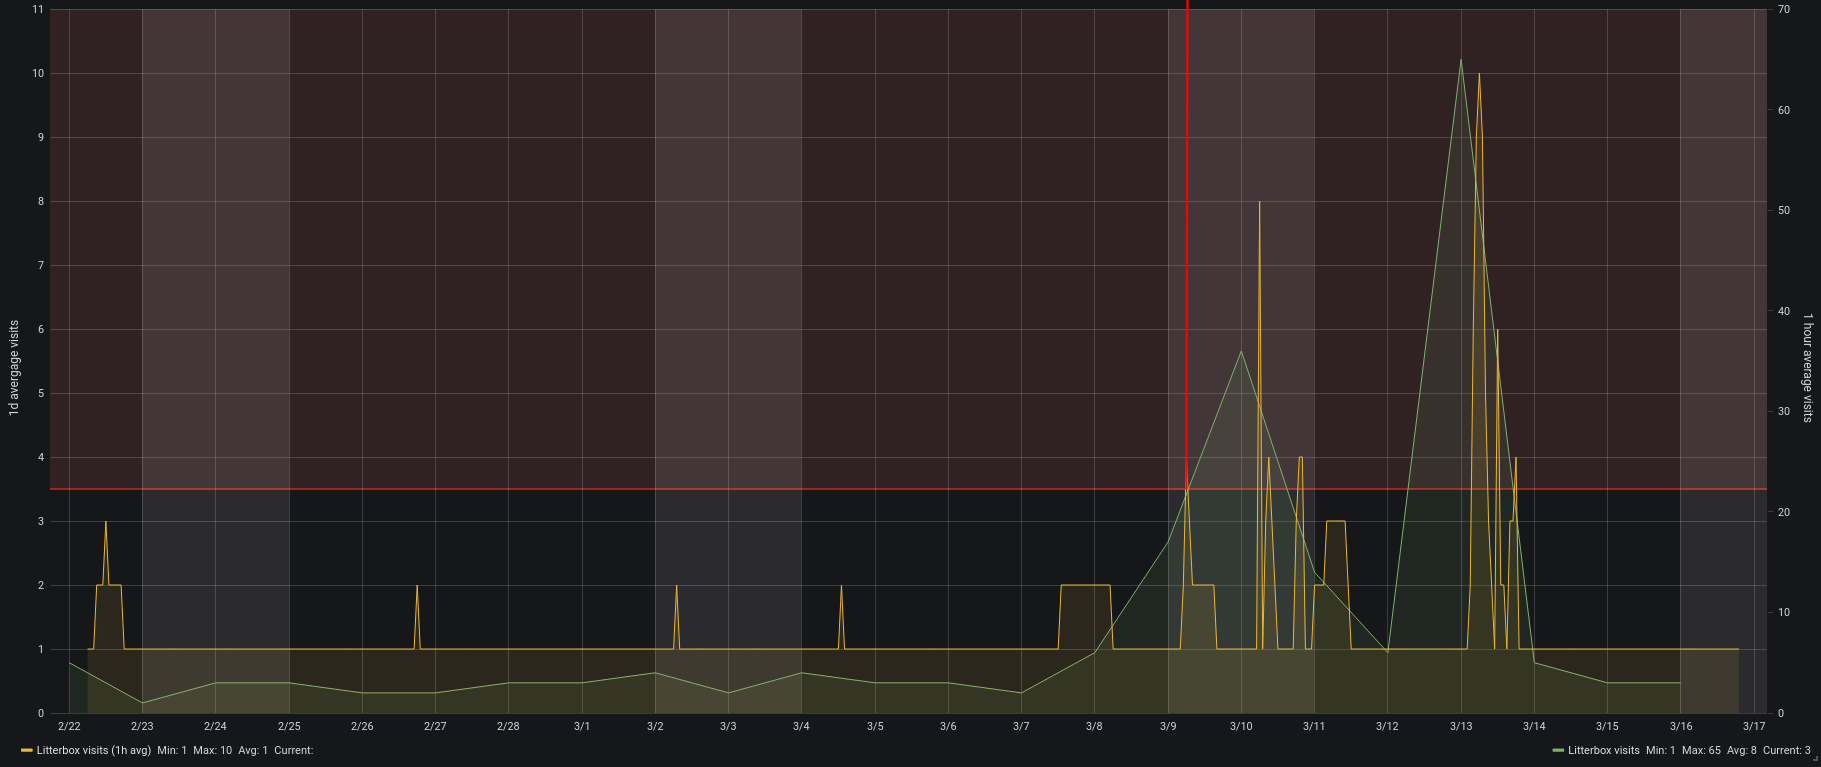
The chart shows the hourly average and daily total visits to the litterbox.
On the morning of March 9th Leela already had been to the litter box above average. So much above average that it tripped the alerting system. You can see the faded read area in the top of the graph above showing the alert threshold. The red vertical line was drawn in by me because this was when we got alerted.
Now what? She behaved totally normal just that she went a lot more to the litter box. We where concerned as it matched her sisters behavior so we went through all the checklists with her on what the issue could be.
We monitored her closely and increased the water supplied as well as changed her food so she could fight a potential bladder infection (or worse).
By Monday she did still not behave different to a degree that anyone would have been suspicious. Nevertheless my wife took her to the vet. And of course a bladder infection was diagnosed after all tests run.
She got antibiotics and around Wednesday (13th March) she actually started to behave much like a sick cat would. By then she already was on day 3 of antibiotics and after just one day of presumable pain she was back to fully normal.
Interestingly all of this can be followed up with the monitoring. Even that she must have felt worse on the 13th.
With everything back to normal now it seems that this monitoring has really lead us to a case of “predictive cat maintenance”. We hopefully could prevent a lot of pain with acting quick. Which only was possible through the monitoring in place.
Monitoring pets is seemingly becoming a thing – which lead to my rather funky post title declaration of the “Internet of Pets”. I know about a certain Volker Weber who even wrote in the current c’t magazine about him monitoring his dogs location.
Health is a huge topic for the future of devices and gadgets. Everyone will casually start to have more and more devices in their daily lifes. Unfortunately most of those won’t be under your own control if you do not insist on being in control.
You do not have to build stuff yourself like I did. You only need to make the right purchase decisions according to things important to you. And one of these things on that checklist should be: “am I in full control of the data flow and data storage”.
If you are not. Do not buy!
By coincidence the idea of having the owner of the data in full control of the data itself is central to my current job at MindSphere. With all the buzz and whistles around the Industry IoT platform it all breaks down to keep the actual owner of the data in control and in charge. A story for another post!
For about 2 years now I am using Todoist as my main task management / todo-list service.
This lead to a lot of interesting statistics and usage patterns as this service seems to integrate oh-so-nicely into a lot of daily tasks.
What kind of integration is it? Glad you asked!
At first we were using all sorts of different ways to manage task lists across the family with the main lists around everything evolved being the personal tasks and todos of each family member as well as the obvious groceries shopping list.
We’ve been happy customers of Wunderlist before but then Microsoft bought it and announced they will shut it down soon and replace it with “Todo” out of Office 365. Not being an Office 365 customer did lead to a dead-end on this path.
And then Amazon Alexa showed up and we wanted to naturally use those assistants around the house to add things to shopping and todo lists right away. Unfortunately neither Wunderlist nor the intermediate solution Toodledo were integrated with Alexa.
Then there suddenly was a window of opportunity We wanted Alexa integration and at least all the features we knew from Wunderlist and Toodledo and Todoist delivered right out of the box.
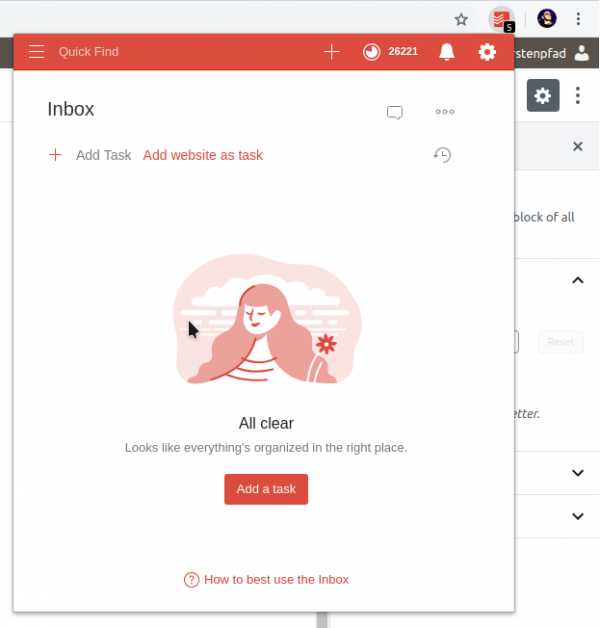
It takes todos and shopping items from Alexa, through the website, through Apps, Siri can use it and in general it’s well integrated with lots of services around. You can even send it eMails! Also we’ve never experienced syncing issues whatsoever.
And it’s the little things that really make a difference. Like that Chrome browser integration above.
You see that “Add website as task”? Yes it does exactly what you would expect. Within Chrome and two clicks you’ve added the current website URL and title as a task to any of your lists in Todoist. I’ve never been a fan of favourites / bookmarks in browsers. Because I usually do not store any history or bookmarks for longer. But I always need to add that website to a list to work through later the day. I used to send myself eMails with those links but with this is a much better solution to keep track of those links and not have them pile up over a long time.
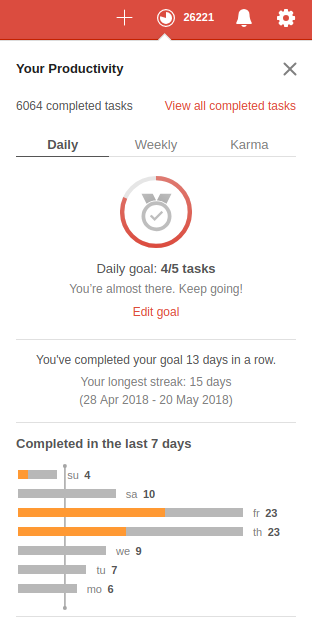
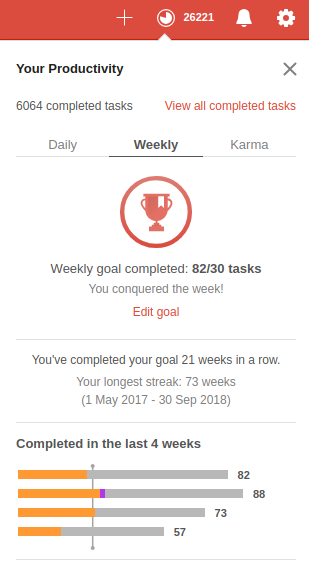
What’s also very nice is the way Todoist generates statistics and tracks your progress over time. There’s a system in Todoist called “Karma”.
Which allows you to marvel at your progress and sun yourself in the immense productivity you’ve shown.
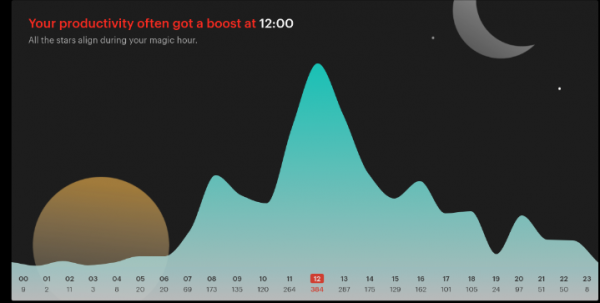
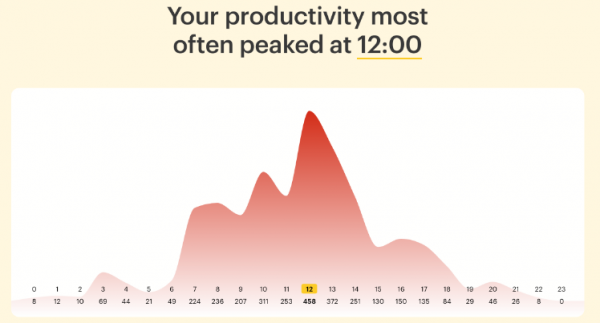
But hey – there’s actual value coming from this. Like if you do it for a year or two you get such nice statistics which show how you did structure your day and how you might be able to improve. Look at a simple yearly graph of how many tasks have been completed at specific times of the day.
2017
2018
So when most people in the office spend their time on lunch breaks I usually complete the most tasks from my task list. Also I am quite early in “before the crowd” and it shows. Lots of stuff done then.
And improvements also show. On a yearly base you can see for example how many tasks you did postpone / re-schedule when. Like those Mondays which are currently the days most tasks get postponed. What to do about that?
When you want to make things happen on a schedule or log them down when they took place a calendar is a good option. Even more so if you are looking for an intuitive way to interact with your home automation system.
Calendars can be shared and your whole family can have them on their phones, tablets and computers to control the house.
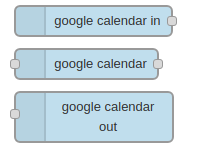
In general I am using the Node-Red integration of Google Calendar to send and receive events between Node-Red and Google. I am using the node-red-node-google package which comes with a lot of different options.
Of course when you are using those nodes you need to configure the credentials
Part 1: Control
So you got those light switches scattered around. You got lots of things that can be switched on and off and controlled in all sorts of interesting ways.
And now you want to program a timer when things should happen.
For example: You want to control when a light is being switched on and when it’s then again been switched off.
I did create a separate calendar on google calendar in which I am going to add events to in a notation I came up with: those events have a start-datetime and of course an end-datetime.
When I now create an event with the name “test” in the calendar…
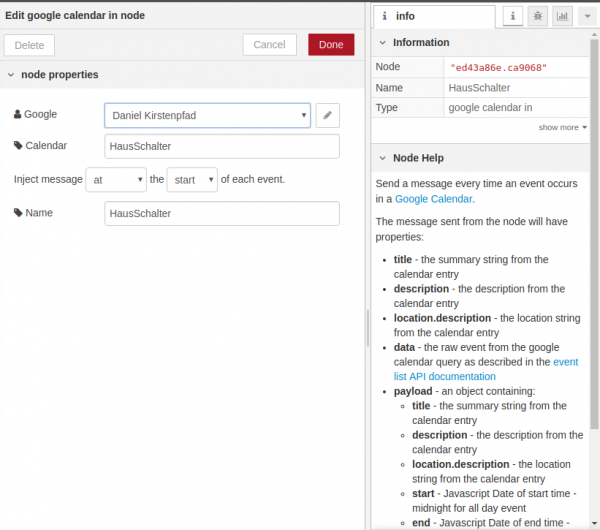
And in Node-Red you would configure the “google calendar in”-Node like so:
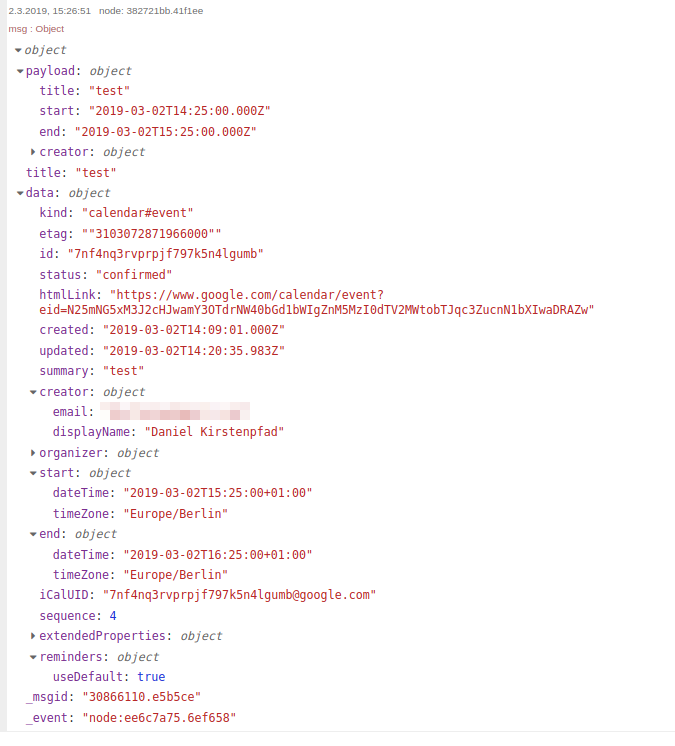
When you did wire this correctly everytime an event in this calendar starts you will get a message with all the details of the event, like so:
With this you can now go crazy on the actions. Like using the name to identify the switch to switch. Or the description to add extra information to your flow and actions to be taken. This is now fully flexible. And of course you can control it from your phone if you wanted.
Part 2: Information
So you also may want to have events that happened logged in the calendar rather than a plain logfile. This comes very handy as you can easily see this way for example when people arrived home or left home or when certain long running jobs started/ended.
To achieve this you can use the calendar out nodes for Node-Red and prepare a message using a function node like this:
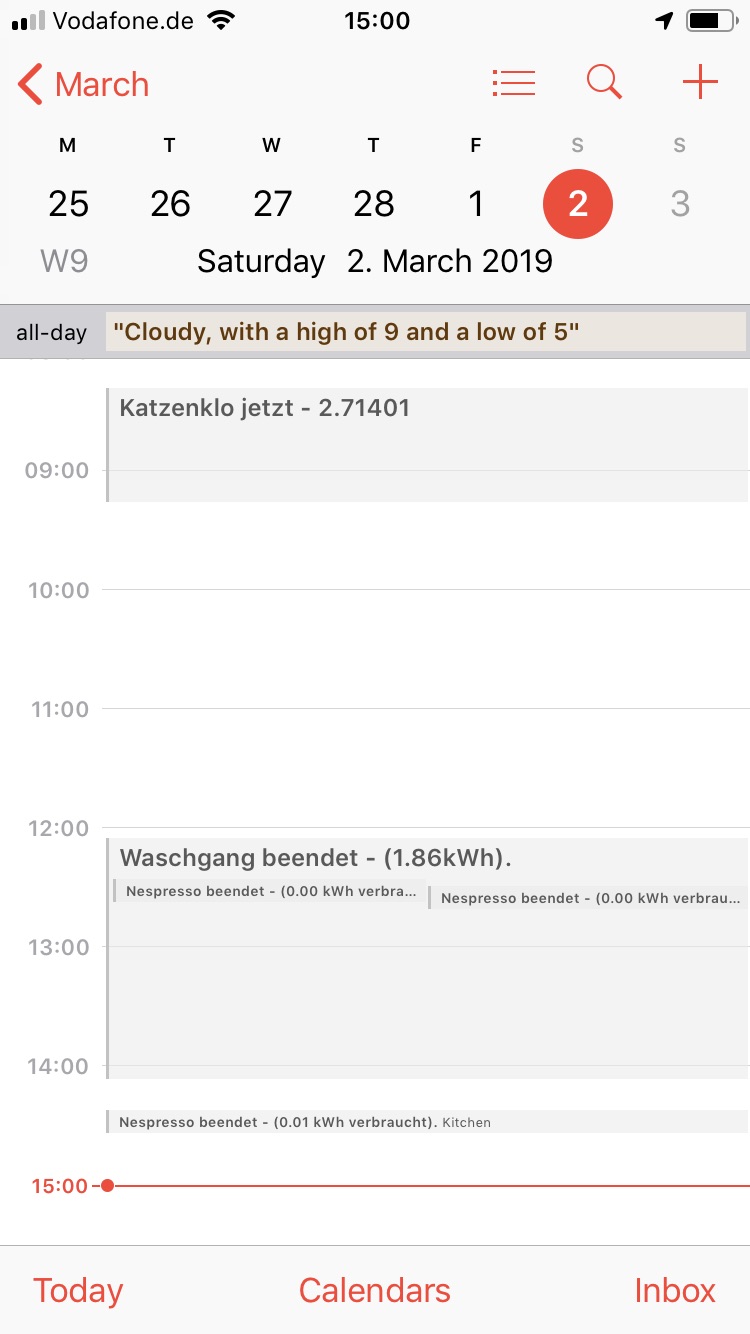
And as said – we are using it for all sorts of things – like when the cat uses her litter box, when the washing machine, dryer, dishwasher starts and finishes. Or simply to count how many Nespresso coffees we’ve made. Things like when members of the household arrive and leave places like work or home. When movement is detected or anything out of order or noteable needs to be written down.
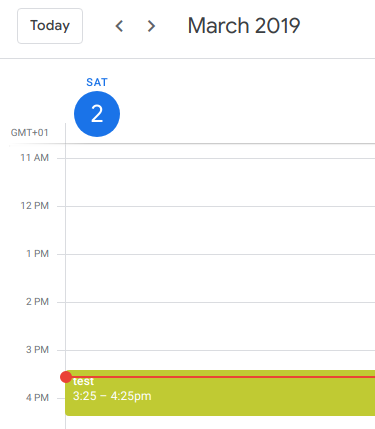
And of course it’s convenient as it can be – here’s the view of a recent saturday:
I was asked recently how I did enable my home automation to send push notifications to members of the household.
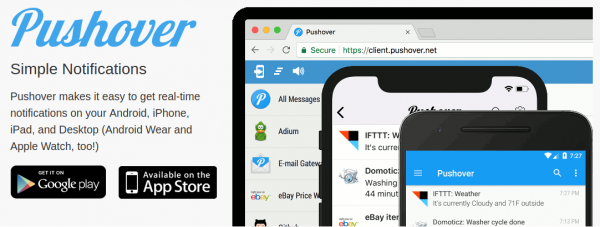
The service I am using on which all of our notification needs are served by is PushOver.
Pushover gives you a simple API and a device management and allows you to trigger notifications with icons and text to be sent to either all or specific devices. It allows to specify a message priority so that more or most important push notifications even are being pushed to the front when your phone is set on do-not-disturb.
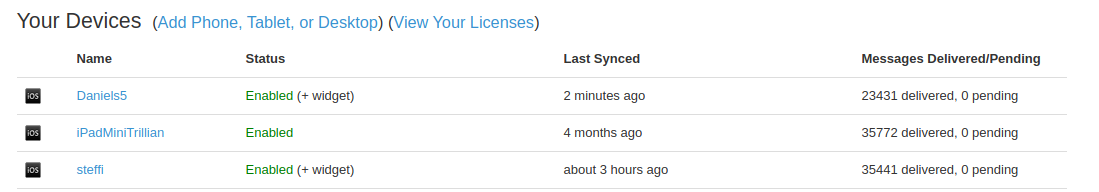
The device management and API, as said, is pretty simple and straight forward.
apparently we’re sending a lot of notifications to these devices…
As for the actual integration I am using the NodeRed integration of Pushover. You can find it here: node-red-contrib-pushover.
With the newest client for iOS it even got integration for Apple Watch. So you not only are limited to text and images. You can also send our a state that updates automatically on your watch face.
As Pushover seems consistent in service and bringing updates I don’t miss anything – yet I do not have extensively tested it on Android.
Working in the IT industry requires us to spend copious amounts of time focused on our screens mostly sitting at our desks. But this does not have to be that way.
For me sitting down for long times creates a lot of unwanted effects and essentially leads to me not being able to focus anymore properly.
In 2015 my wife and I attacked that “health problem” as a team. And in the 12 months until 2016 we both lost 120 kg / 260lbs added up together in body weight and completely changed the way we deal with food and sport.
With that I also changed the way I work. Sitting down was from now on the exception.
Coincident with this lifestyle change my then-employer Rakuten rolled out it’s then new workplace concept and everyone got great electric stand-up desks that allowed you to change the height up and down effortlessly.
When I started with SIEMENS of course their workplace concept included standing desks as well!
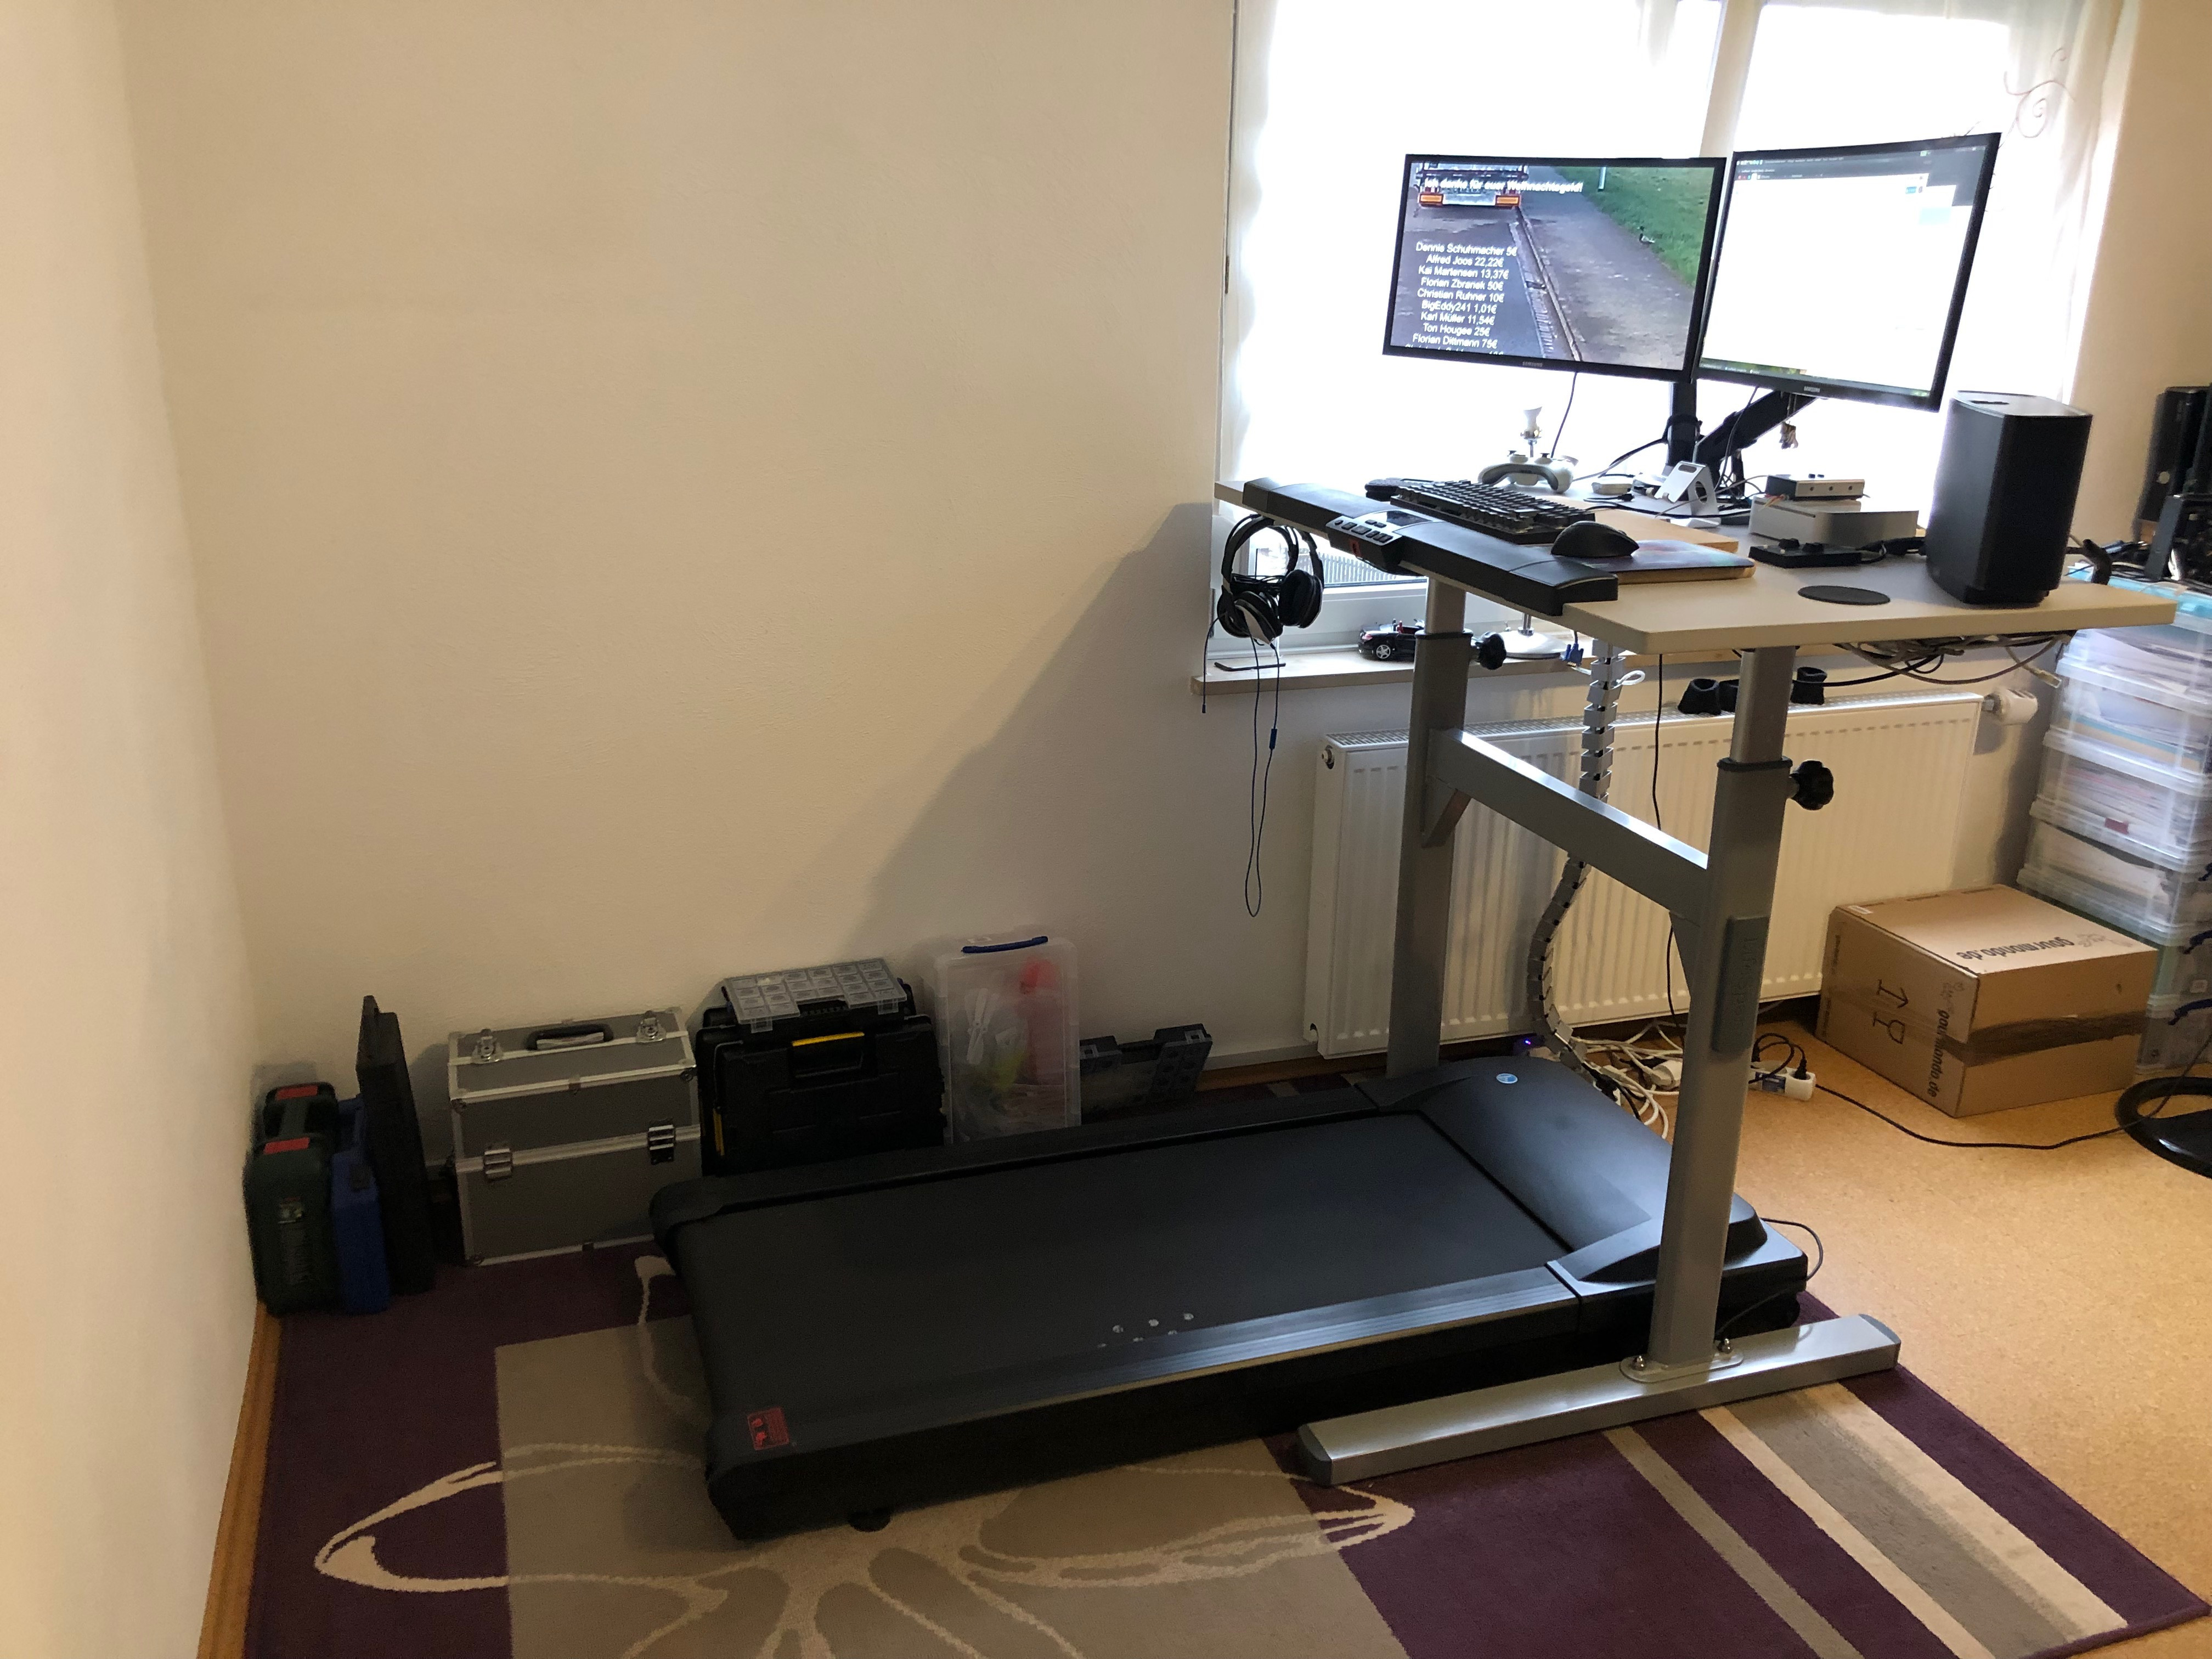
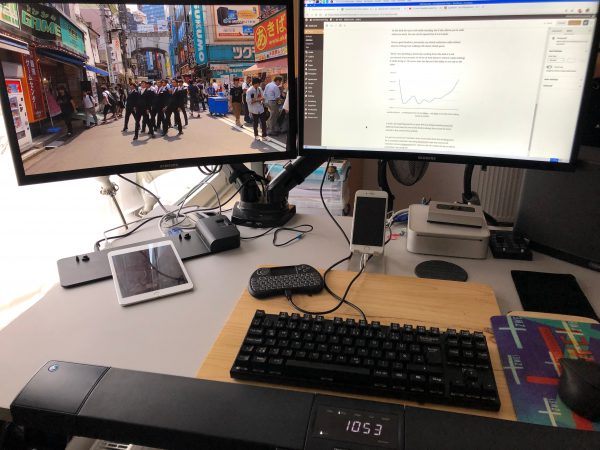
For those times I am working from home one of the desks is equipped with a standing desk with an additional twist.
So this desk let’s you work while standing. But it also allows you to walk while you work. You can set the speed from 0 to 6.4 km/h.
Given a good headset I personally can attend conference calls without anyone noticing I am walking with about 4 km/h paces.
When I am spending a whole day working from this desk it is not uncommon to accumulate 25-40 km of total distance without really noticing it while doing so. Of course: later the day you’ll feel 40km in one way or the other
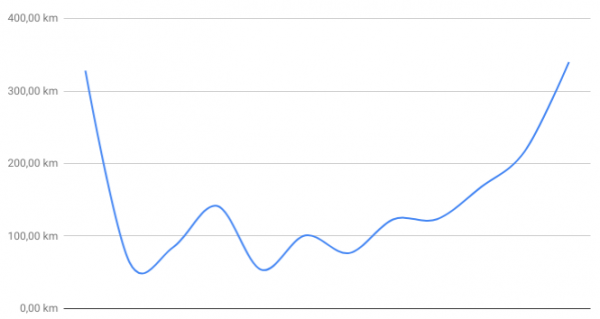
monthly distance … something between 50 and 350km … only 50km at the desk when walking outside is possible.
It took a bit of getting used to as your feet are doing something entirely different from what the rest of the body is doing. But at least for me it started to feel natural very quickly.
I’ve put two curved 24″ monitors onto it and aside from the docking ports for a company notebook I am using thinclients to get my usual work machines screens teleported there. There’s a bit of a media set-up as well as sometimes I am using one of the screens for watching videos.
For those now interested in the purchase of such a great walking desk: I can only recommend doing so! But be aware of some thoughts:
There are not a lot of vendors of such appliances. And those vendors are not selling a lot of them. This means: be ready for a € 1000+ purchase and be ready to shell out some good money on extended warranties.
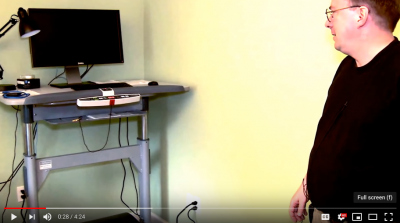
My first desk + treadmill was replaced 3 times before. It was LifeSpans first generation of treadmill desks and it just kept exploding. I actually had glowing sparks of fire spitting out of the first generation treadmill.
I’ve returned it for no money loss and waited for the second generation. This current, second generation of LifeSpan treadmill desks is really doing it for me for longer than the first generation ever had without breaking. Looking at the use of the device I would see it as a purchase over 5 years. After 5 years of actual and consistent use I wouldn’t be overly annoyed if the mechanical parts of the appliance would stop working. I am not expecting such a device to live much longer anyhow.
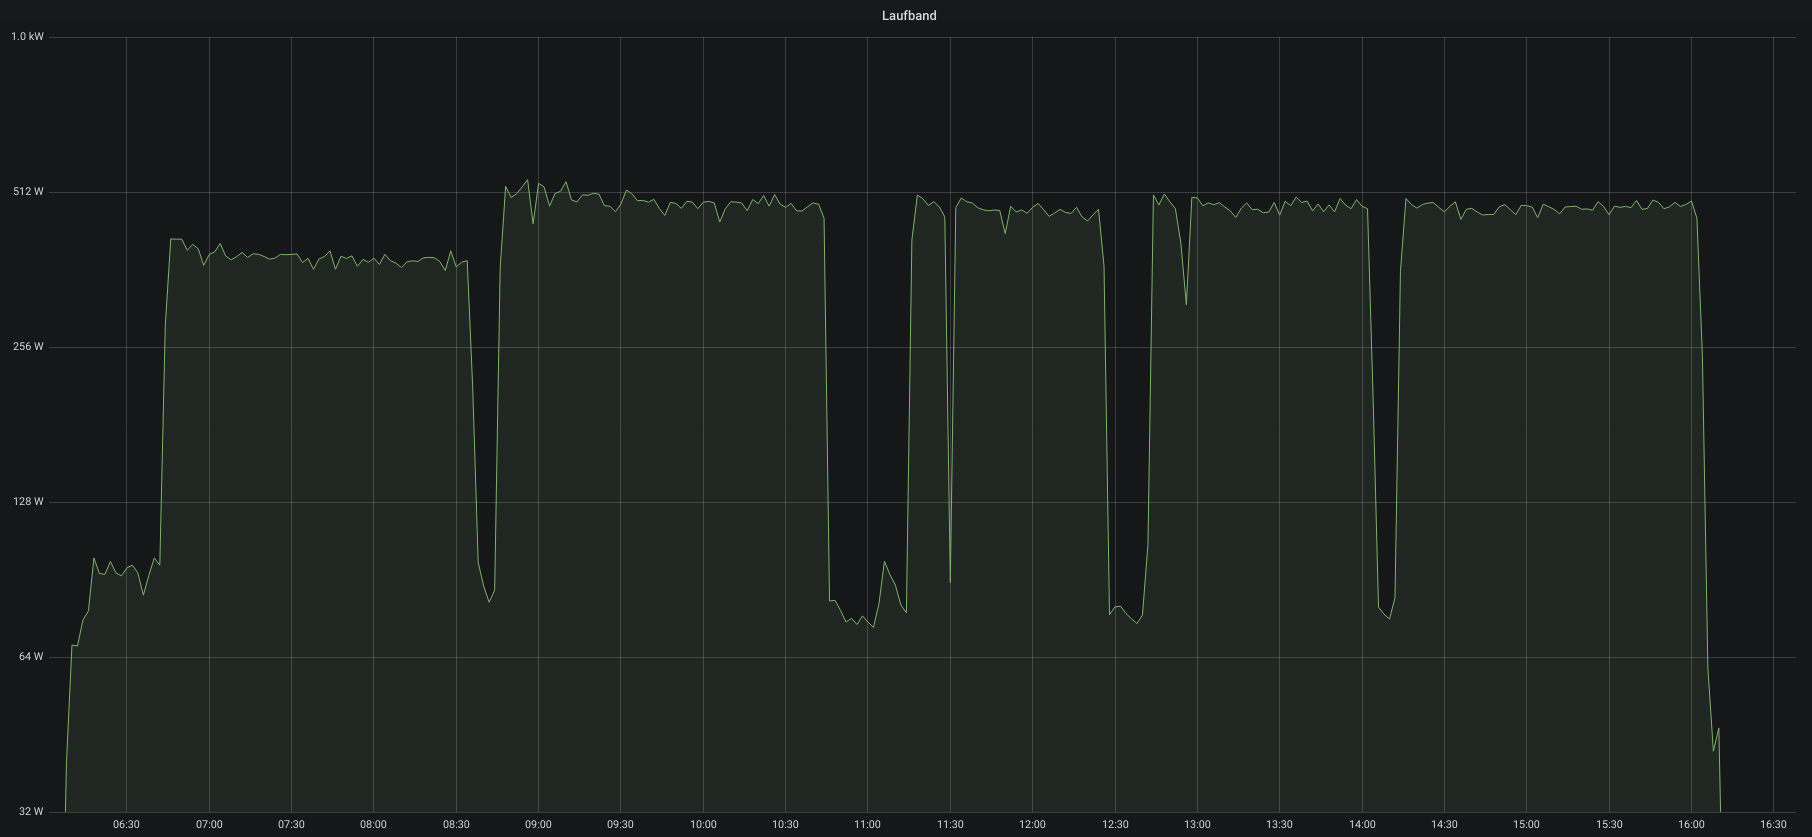
Energy consumption wise it’s quite impressive how much energy this thing consumes. I wasn’t quite expecting those levels. So here’s for you to know:
this is a 28km workday with some pauses
So just around 500 Watts when in use. The 65W base load is the monitors and computers on top.
did you know: Linus Torvalds used to use a first generation model – the one that broke on me many times
I can only recommend to try something like this out. Unfortunately it’s quite hard to find a place to try it out. At least I was not able to try before buy.
But then again I could answer your questions if you had any.
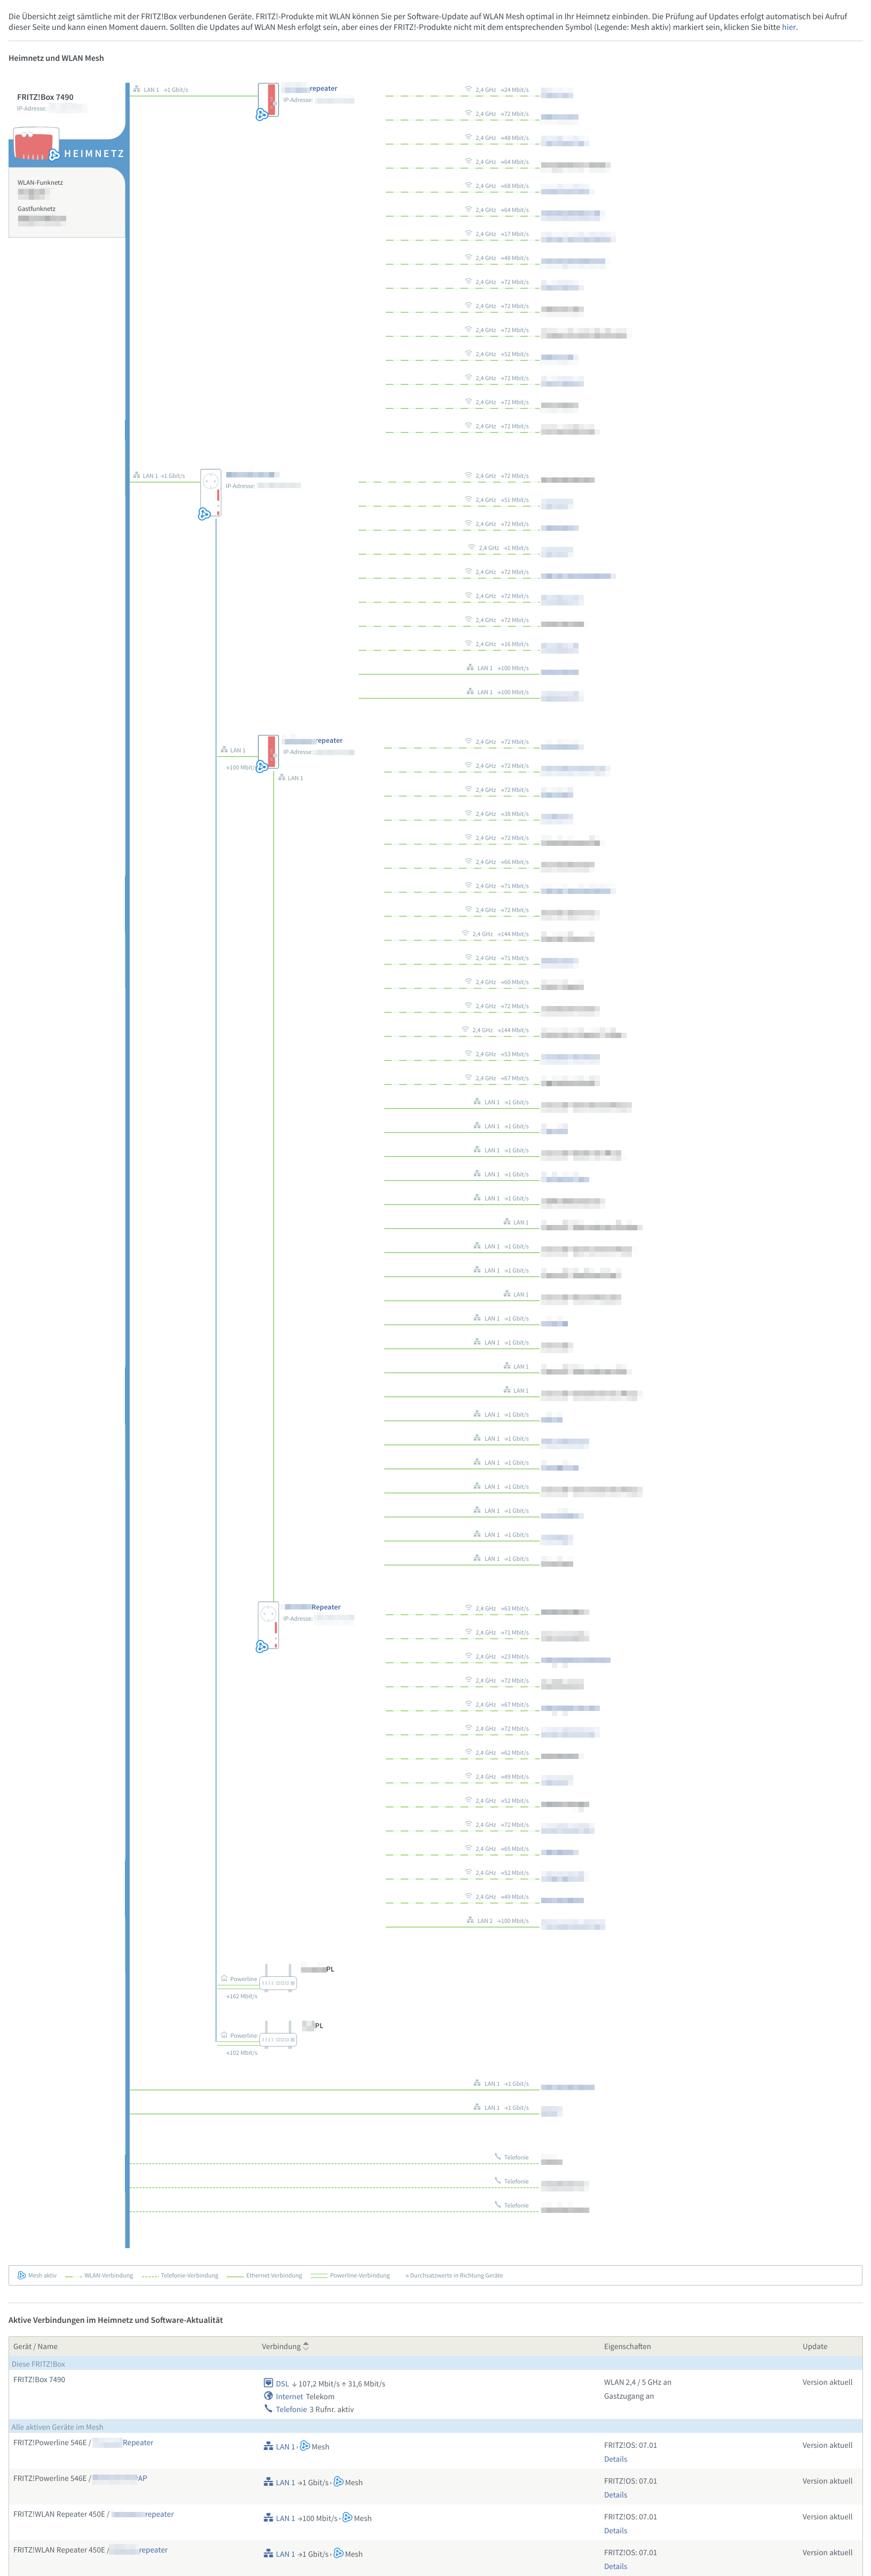
Since AVM has started to offer wireless mesh network capabilities in their products through software updates I started to roll it out in our house.
Wireless mesh networks often consist of mesh clients, mesh routers and gateways. Mobility of nodes is less frequent. If nodes constantly or frequently move, the mesh spends more time updating routes than delivering data. In a wireless mesh network, topology tends to be more static, so that routes computation can converge and delivery of data to their destinations can occur. Hence, this is a low-mobility centralized form of wireless ad hoc network. Also, because it sometimes relies on static nodes to act as gateways, it is not a truly all-wireless ad hoc network.
With the rather complex physical network structure and above-average number of wireless and wired clients the task wasn’t an easy one.
To give an impression of what is there right now:
So there’s a bit of almost everything. There’s wired connections (1Gbit to most places) and there is wireless connections. There are 5 access points overall of which 4 are just mesh repeaters coordinated by the Fritz!Box mesh-master.
There’s also powerline used for some of the more distant rooms of the mansion. All in all there are 4 powerline connections all of them are above 100 Mbit/s and one even is used for video streaming.
All is managed by a central Fritz!Box and all is well.
Like without issues. Even interesting spanning-tree implementations like from SONOS are being properly routed and have always worked without issues.
The only other-than-default configuration I had made to the Fritz!Box is that all well-known devices have set their v4 IPs to static so they are not frequently switching around the place.
How do I know it works? After enabling the Mesh things started working that have not worked before. Before the Mesh set-up I had several accesspoints independently from each other on the same SSID. Which would lead to hard connection drops if you walked between them. Roaming did not work.
With mesh enabled I’ve not seen this behavior anymore. All is stable even when I move actively between all floors and rooms.
We use the term “smart home” lightly these days. It has become a term of marketing and phantastic stories.
Considering how readily available lots of different sensors, actors and personal-assistants are these days one would think that most people would start to expect more from the marketing “smart-home”.
I believe that the smart is to be found in the small and simple. There are a lot of small things that actually make something feel smart without it actually being smart about anything.
Being smart is something not achieved yet – not even by a far stretch of the sense of the word. So let’s put that to the sides of the discussion for now and move a simple thing in the middle of this article.
Have you ever had an argument about who should or should have cleared out the dishwasher after it’s finished?
We had.
So we outsourced the discussion and decision to a 3rd party. We made our house understand when the dishwasher starts and ends it’s task. And made it flip a coin.
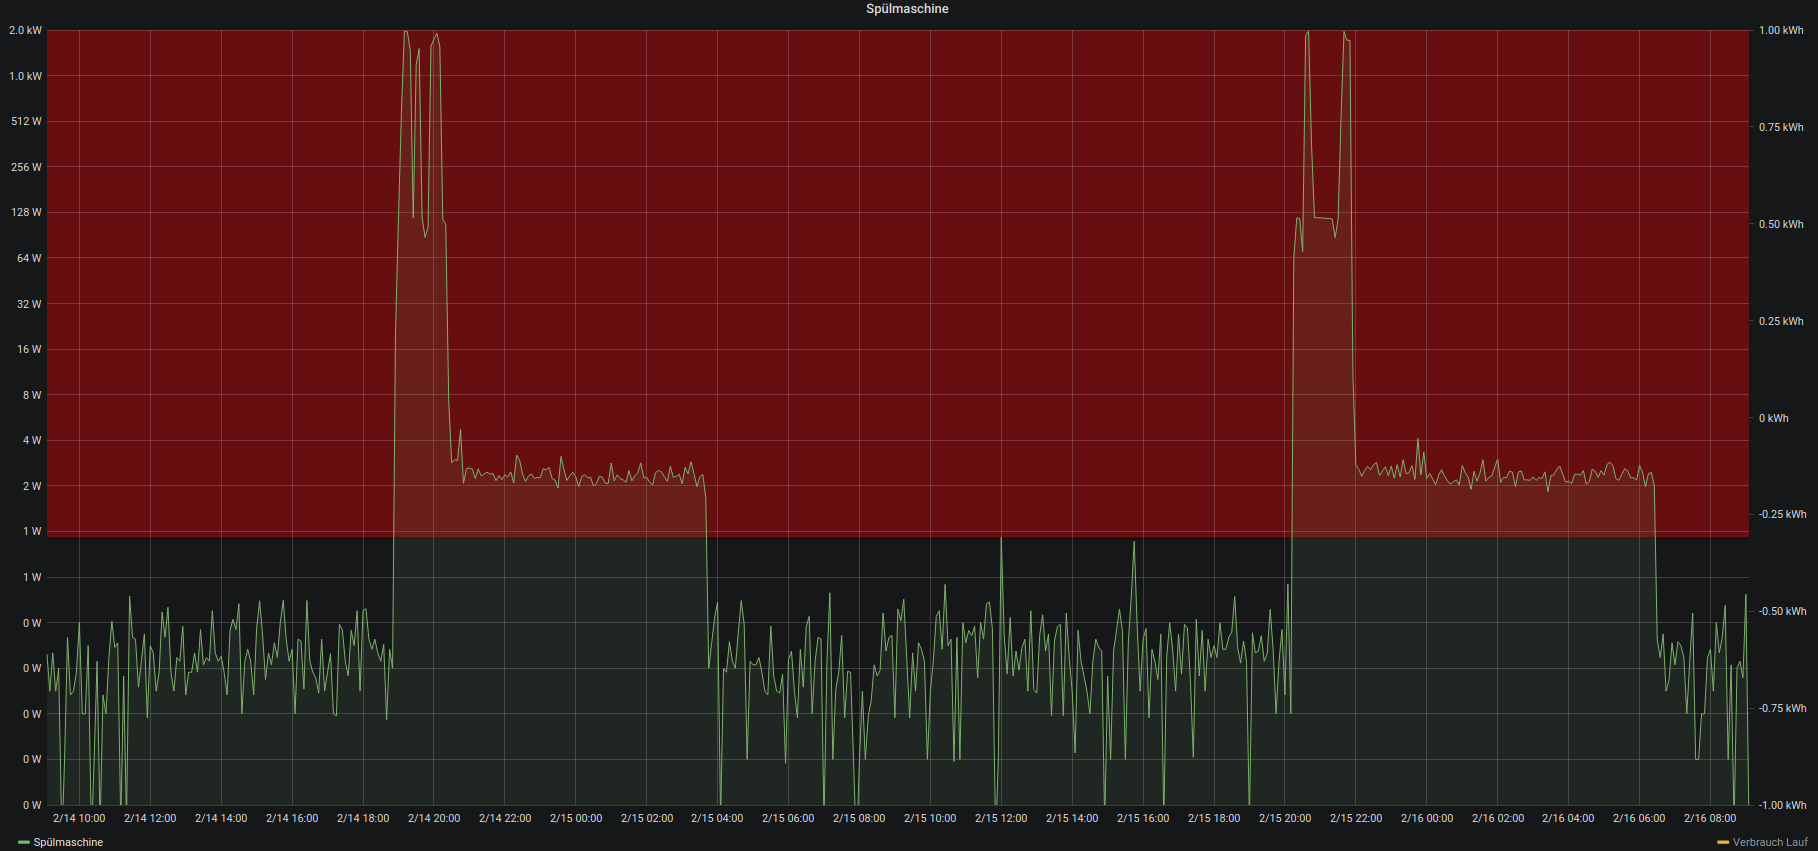
There was already a power consumption monitoring in place for the dishwasher. Adding a hysteresis over that monitoring would yield a simple “starts running” / “stops running” state of the dishwasher.
Pictured above is said power consumption.
When the values enter the red area in the graph the dishwasher is considered to be running.
When it leaves that area the dishwasher is considered finished/not running
Now adding a bit of random coin-tossing by the computer and each time when the dishwasher is detected to have started work a message is sent out depending on the result of the coin-toss.
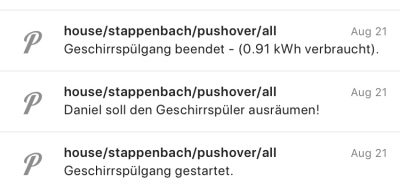
That message is published and automatically displayed on all active displays in the house (TVs/…) and sent as push notifications to all members that need to be informed of this conclusive and important decision.
In short:
Everyone gets a push notification who is going to clear out the dishwasher based upon a coin-toss by a computer every time the dishwasher starts.
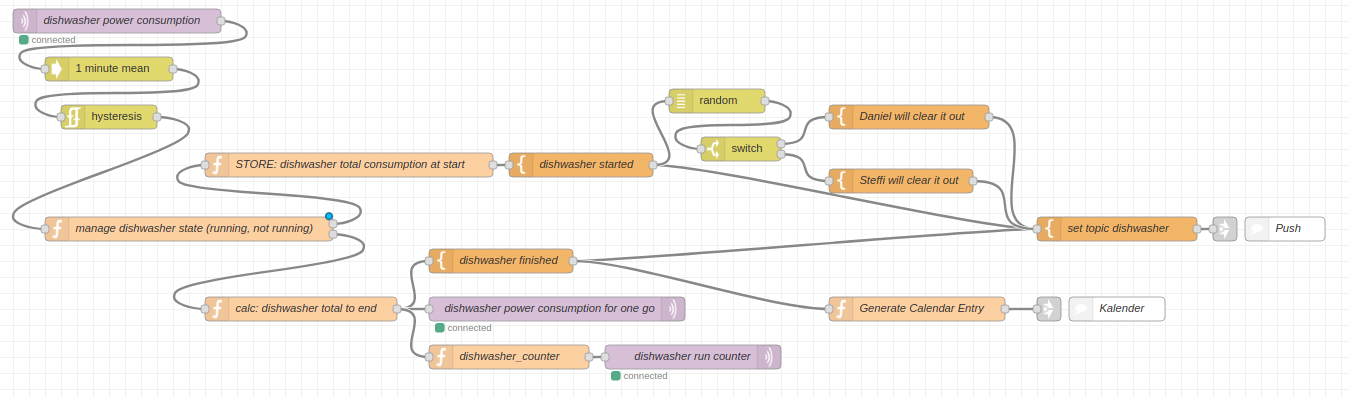
The base of all of this is a Node-RED flow that that uses the power consumption MQTT messages as an input and outputs back to MQTT as well as pushes out the push notifications to phones, screens and watches.
Additionally it creates a calendar entry with the start-finish time of the dishwasher run as well as the total energy consumption for this run.
Node-RED flow
The flow works like this: on the right the message enters the flow from MQTT. The message itself contains just the value of the power consumed at this very moment. In this case consumed the dishwasher.
The power consumption is updated regularly, every couple of seconds this way. So every couple of seconds this flow runs and gets an updated value of
Next a hysteresis is applied. In simple terms this means: when the value goes above a certain threshold the dishwasher is considered to be running. When it goes below a certain threshold then it is considered finished.
When the dishwasher changed it’s state to “running” the flow will generate a random number between 0 and 1. This give a 50:50 chance for either Steffi or Daniel be the chosen one to clear out the dishwasher for this run. This message is sent out as push notification to all phones, watches and TVs.
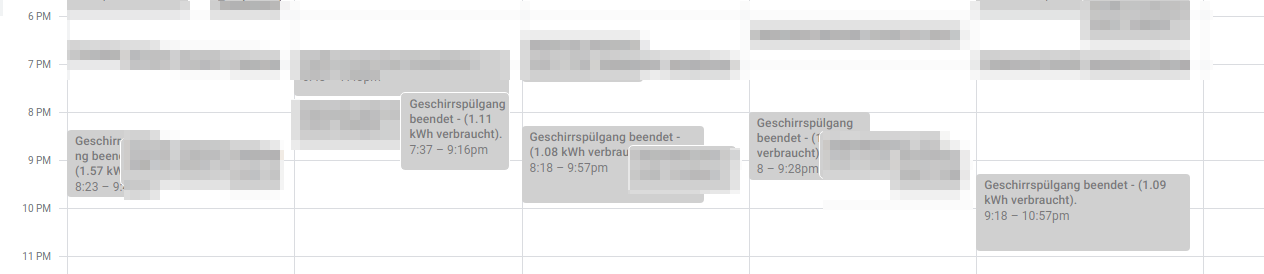
When the dishwasher finishes it’s run the total energy consumption is taken and sent out as the “I am done message”. Also this information is added to the calendar. Voilá.
the real smart home has a calendar!
A calendar? Why a calendar you may ask. Oh well there are several reasons. Think of calendars as another way to interact with the house. All sorts of things happen on a timeline. A calendar is only a visual aid to interact with timelines.
May it be a home appliance running and motion being sensed for your home alarm system. All of that can be displayed in a calendar and thus automatically sync to all your devices capable to display this calendar.
And if you start adding entries to a calendar that the house uses to know what to do next… how about putting light on-off times into an actual calendar right on your phone instead of a complicated browser user interface like many of those marketing smart-homes want us to use?
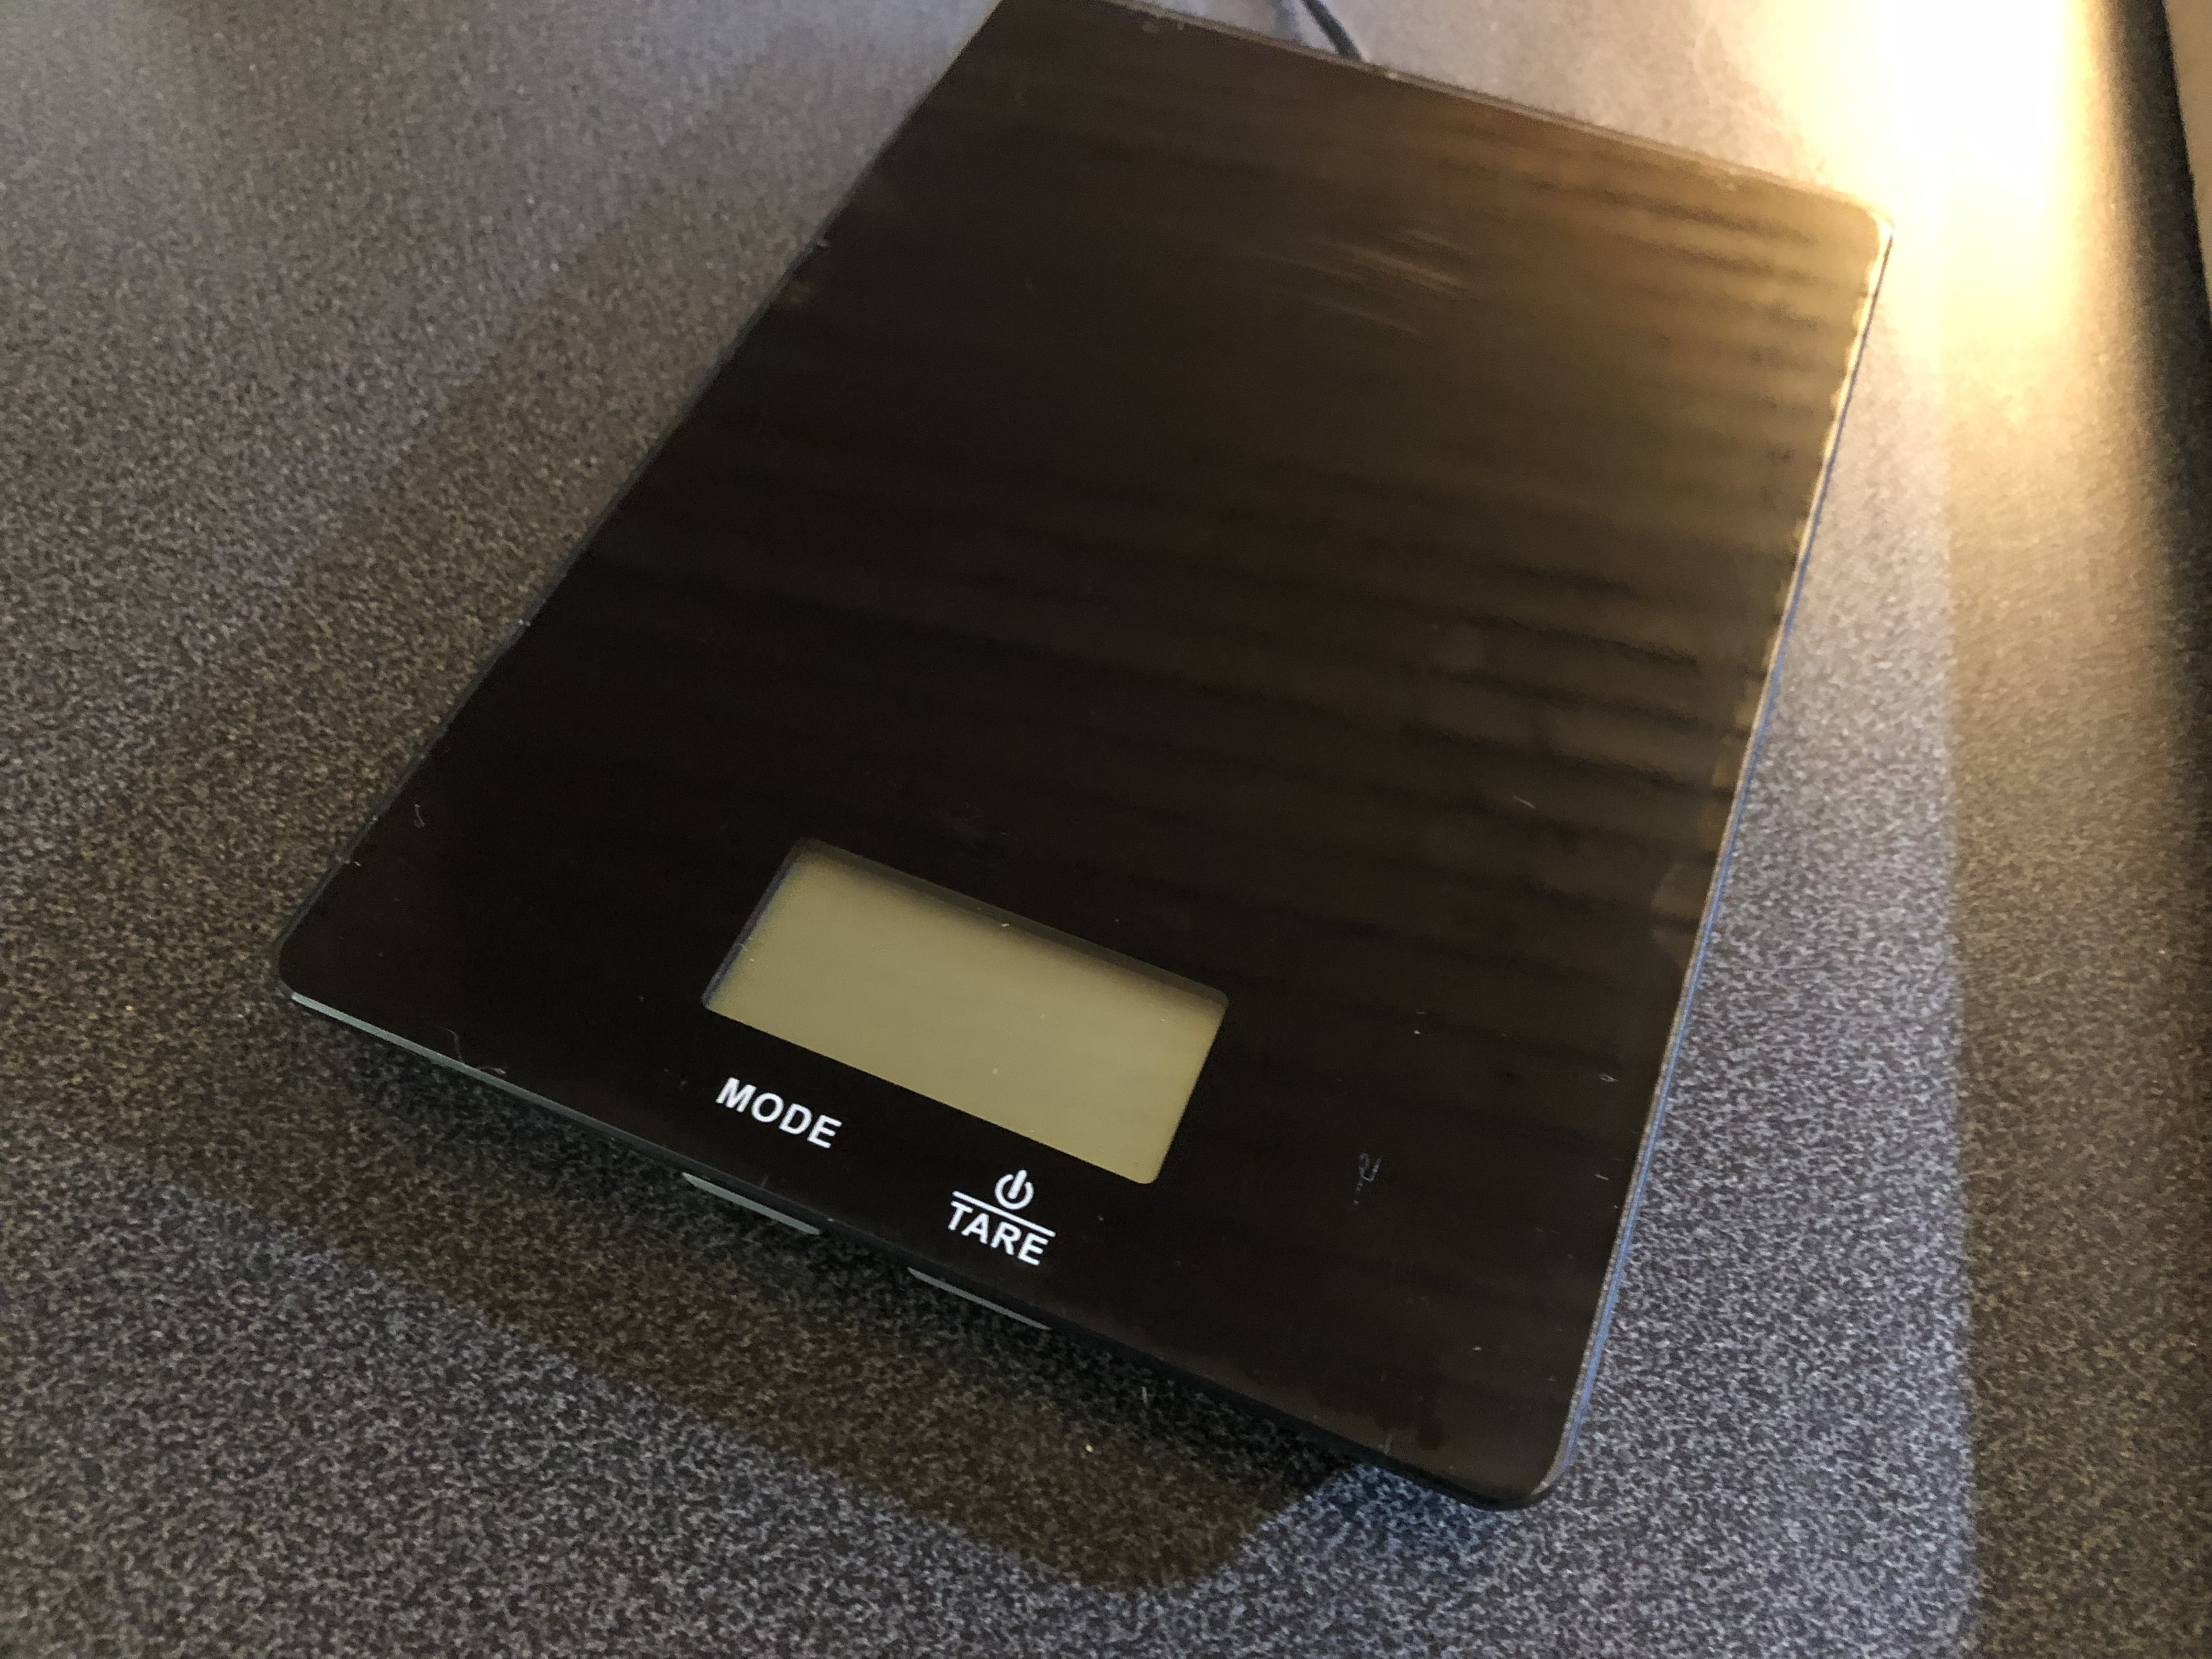
Ever since we had changed our daily diet we started to weigh everything we eat or cook. Like everything.
Quickly we found that those kitchen scale you can cheaply buy are either not offering the convenience we are looking for or regularly running out of power and need battery replacements.
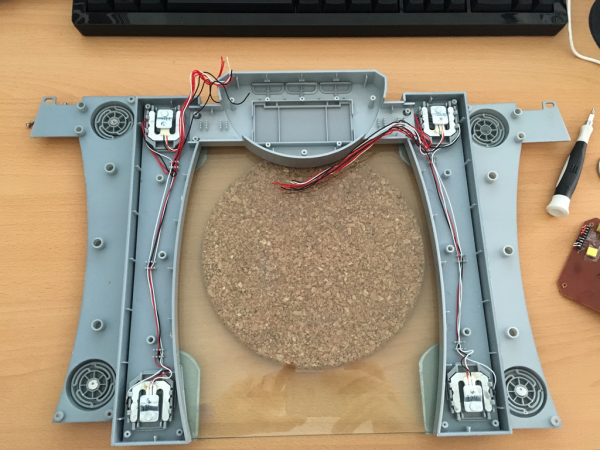
As we already have all sorts of home automation in place anyway the idea was born to integrate en ESP8266 into two of those cheap scales and – while ripping out most of their electronics – base the new scale functionality on the load cells already in the cheap scale.
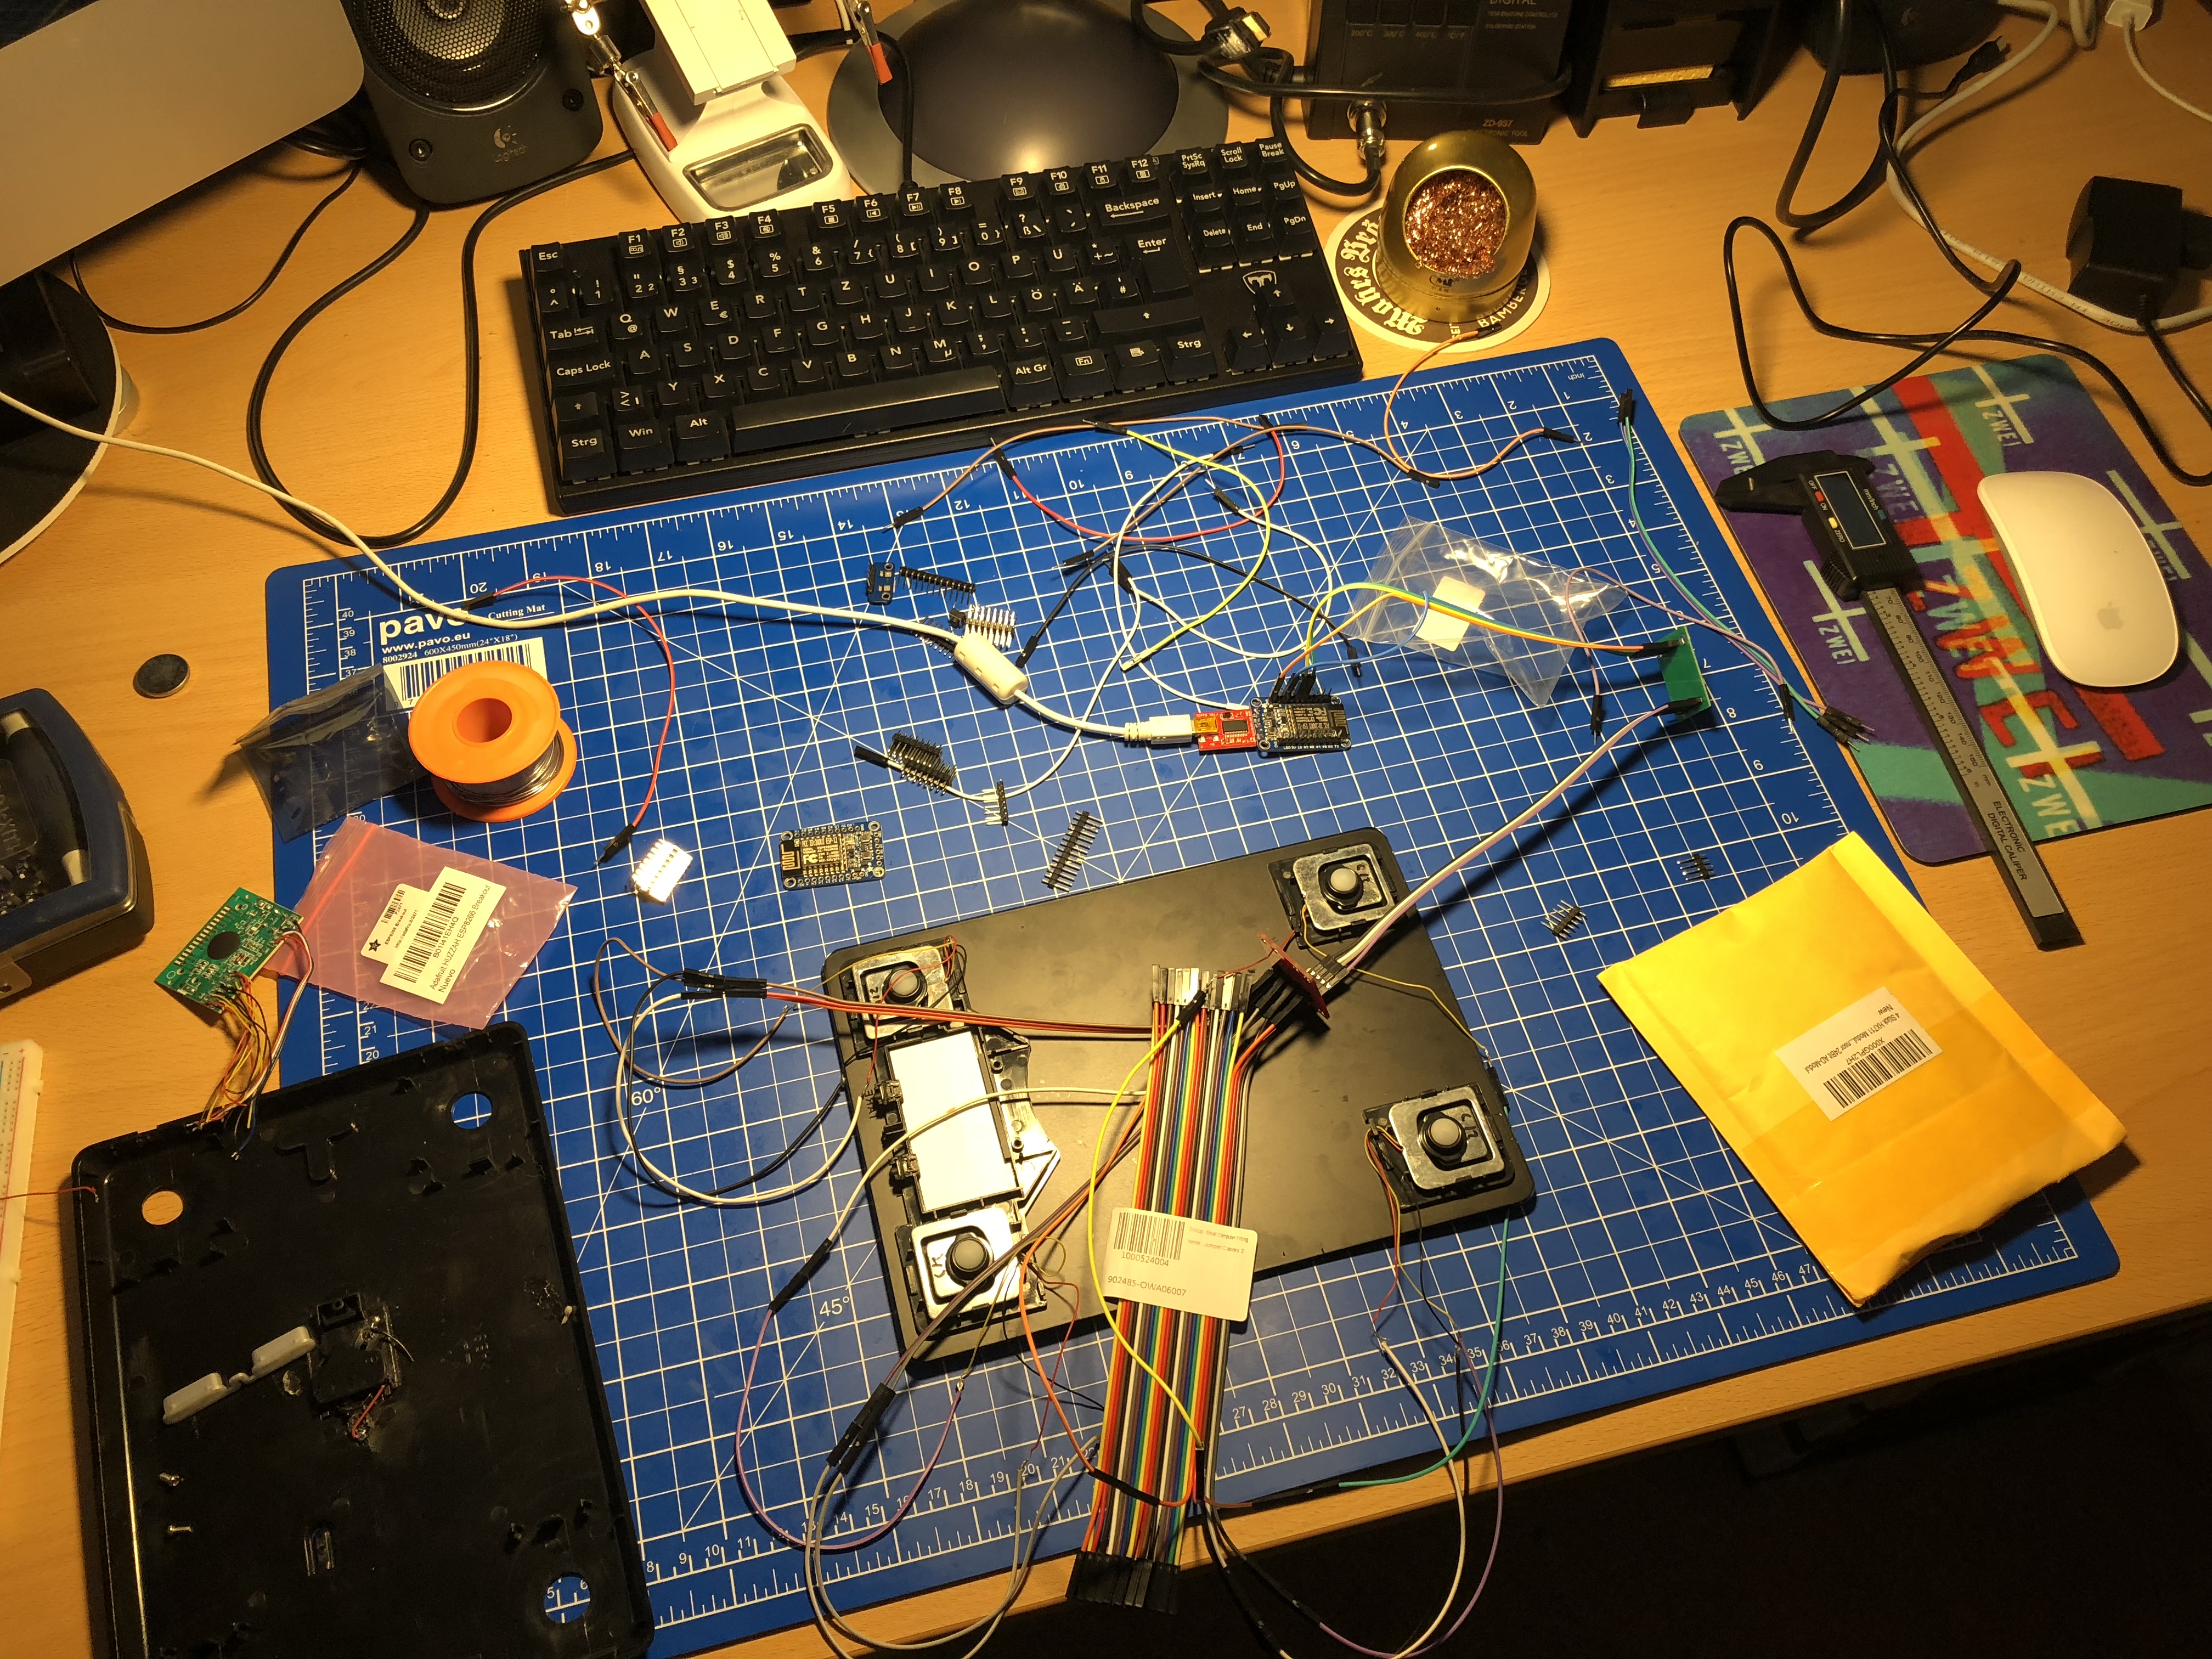
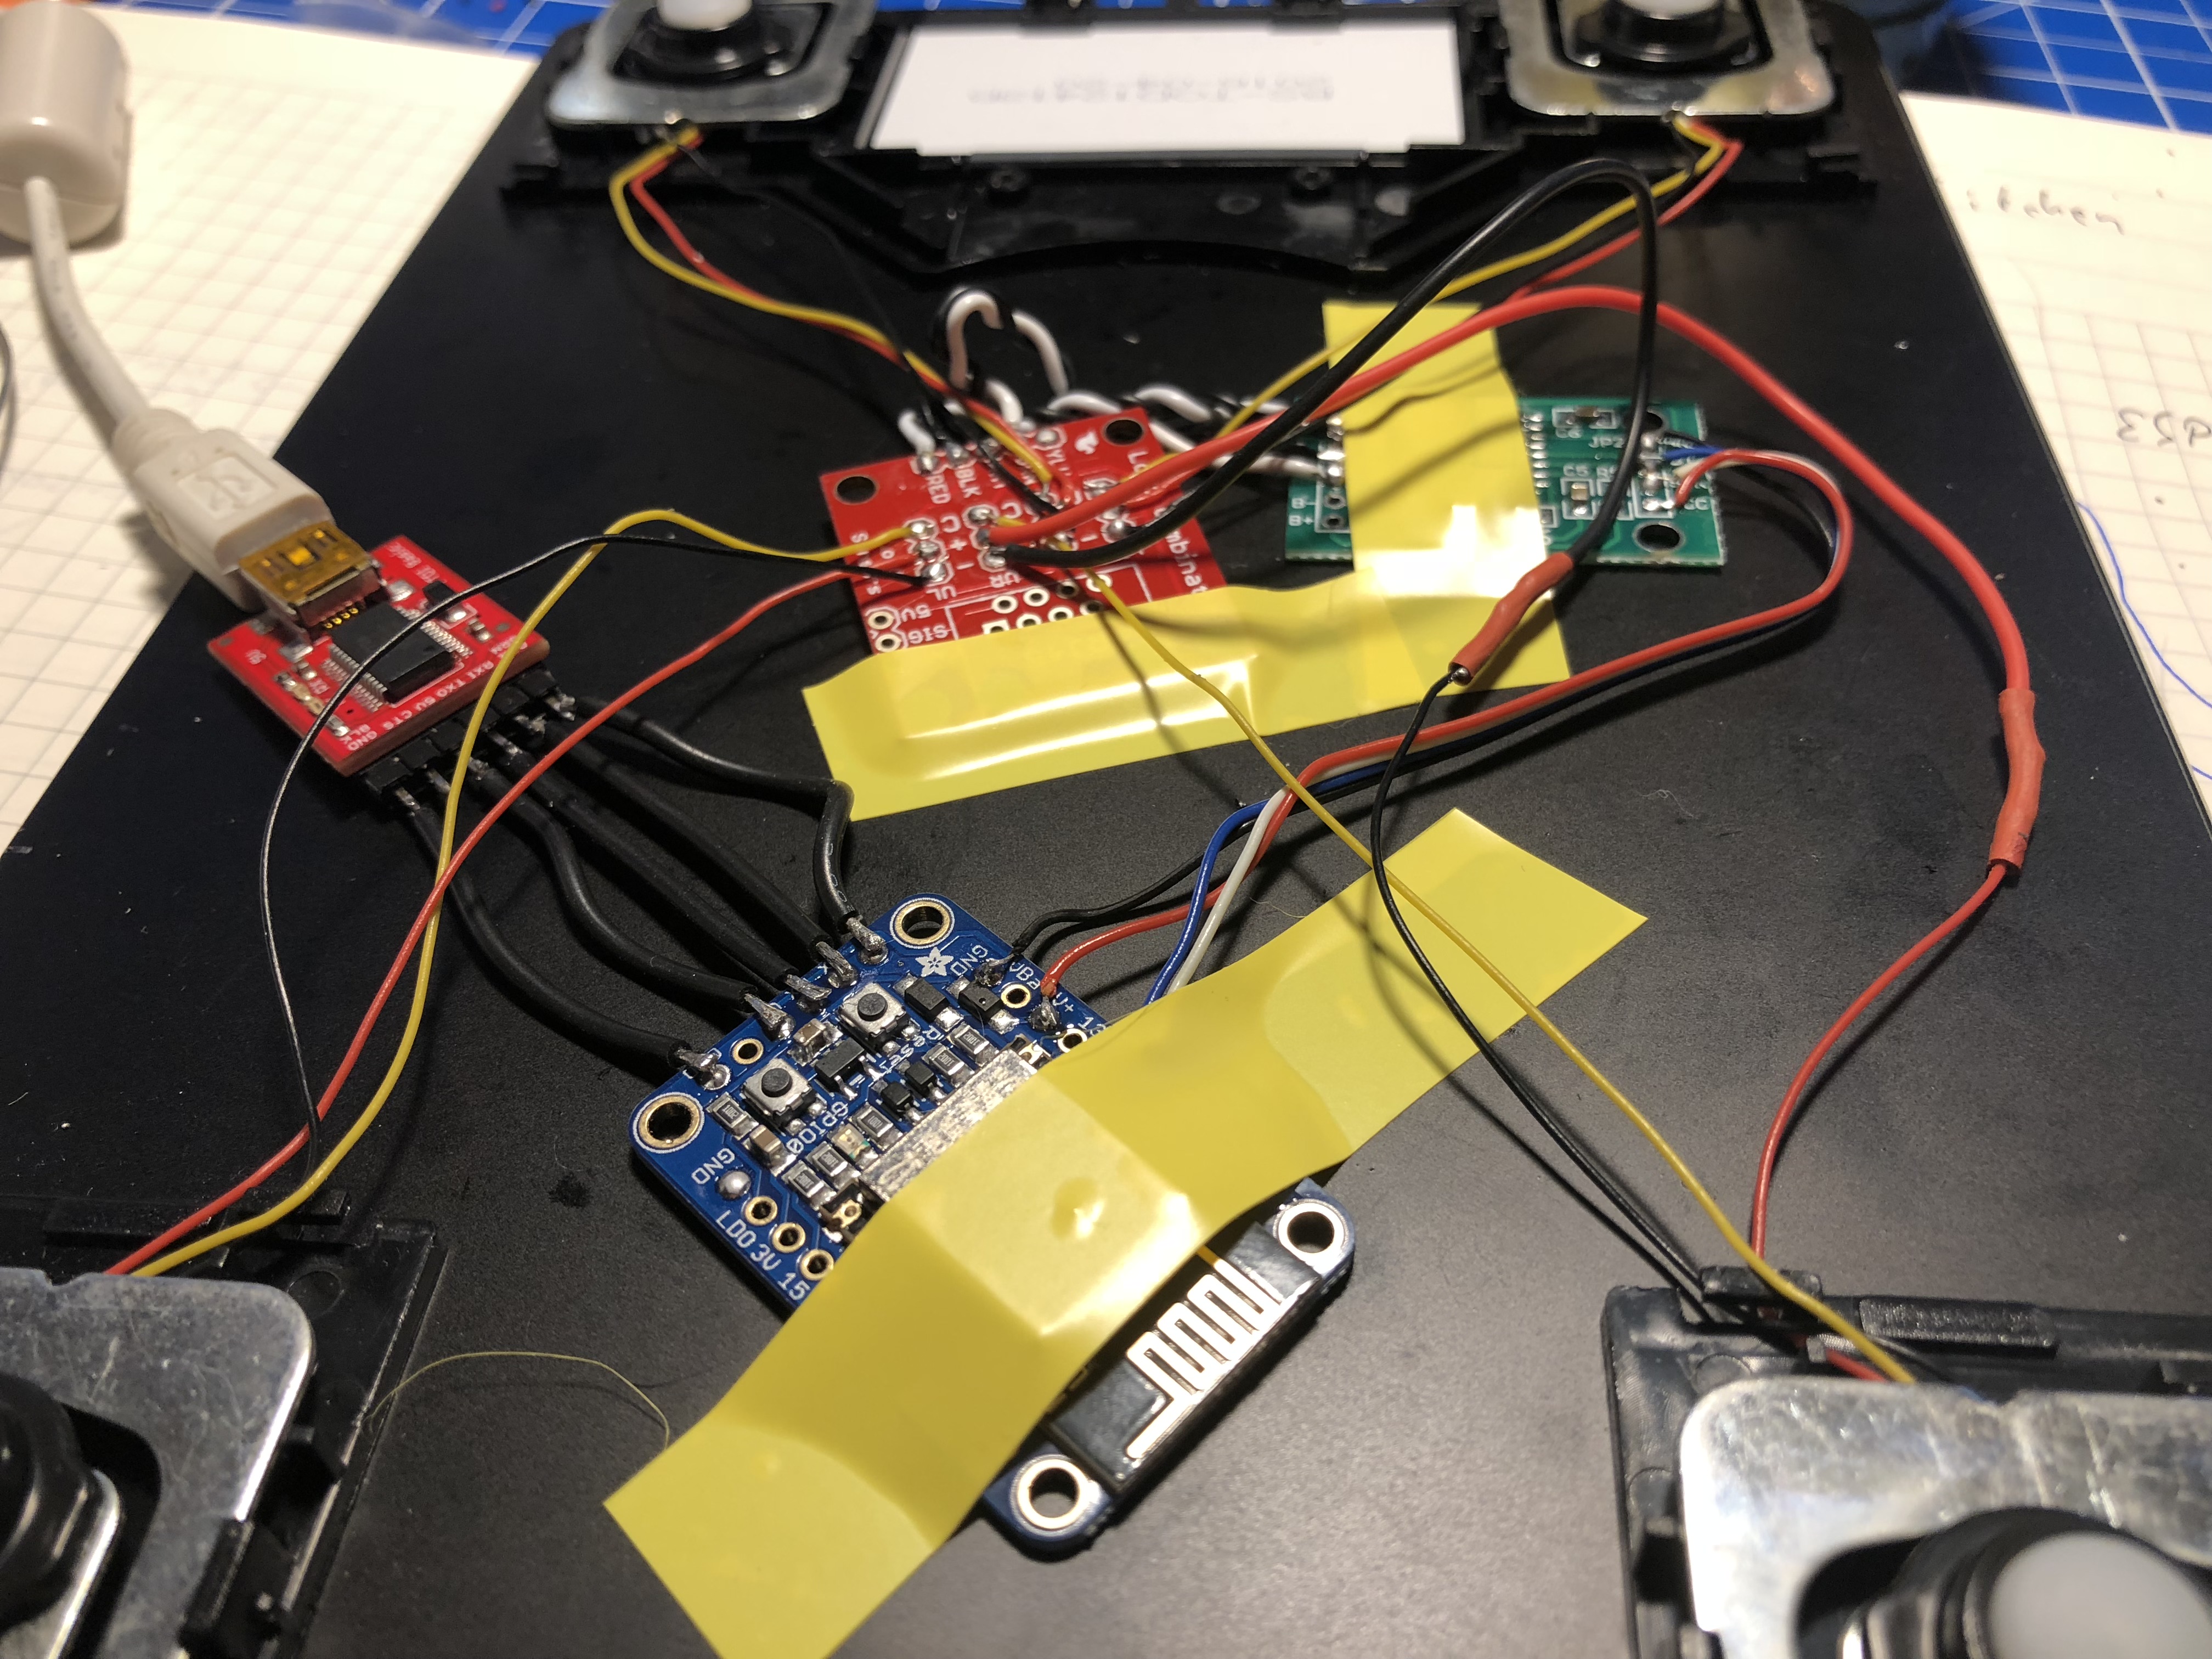
So one afternoon in January 2018 I sat down and put all the parts together:
ESP8266 + HX711 + 4 Load Cells
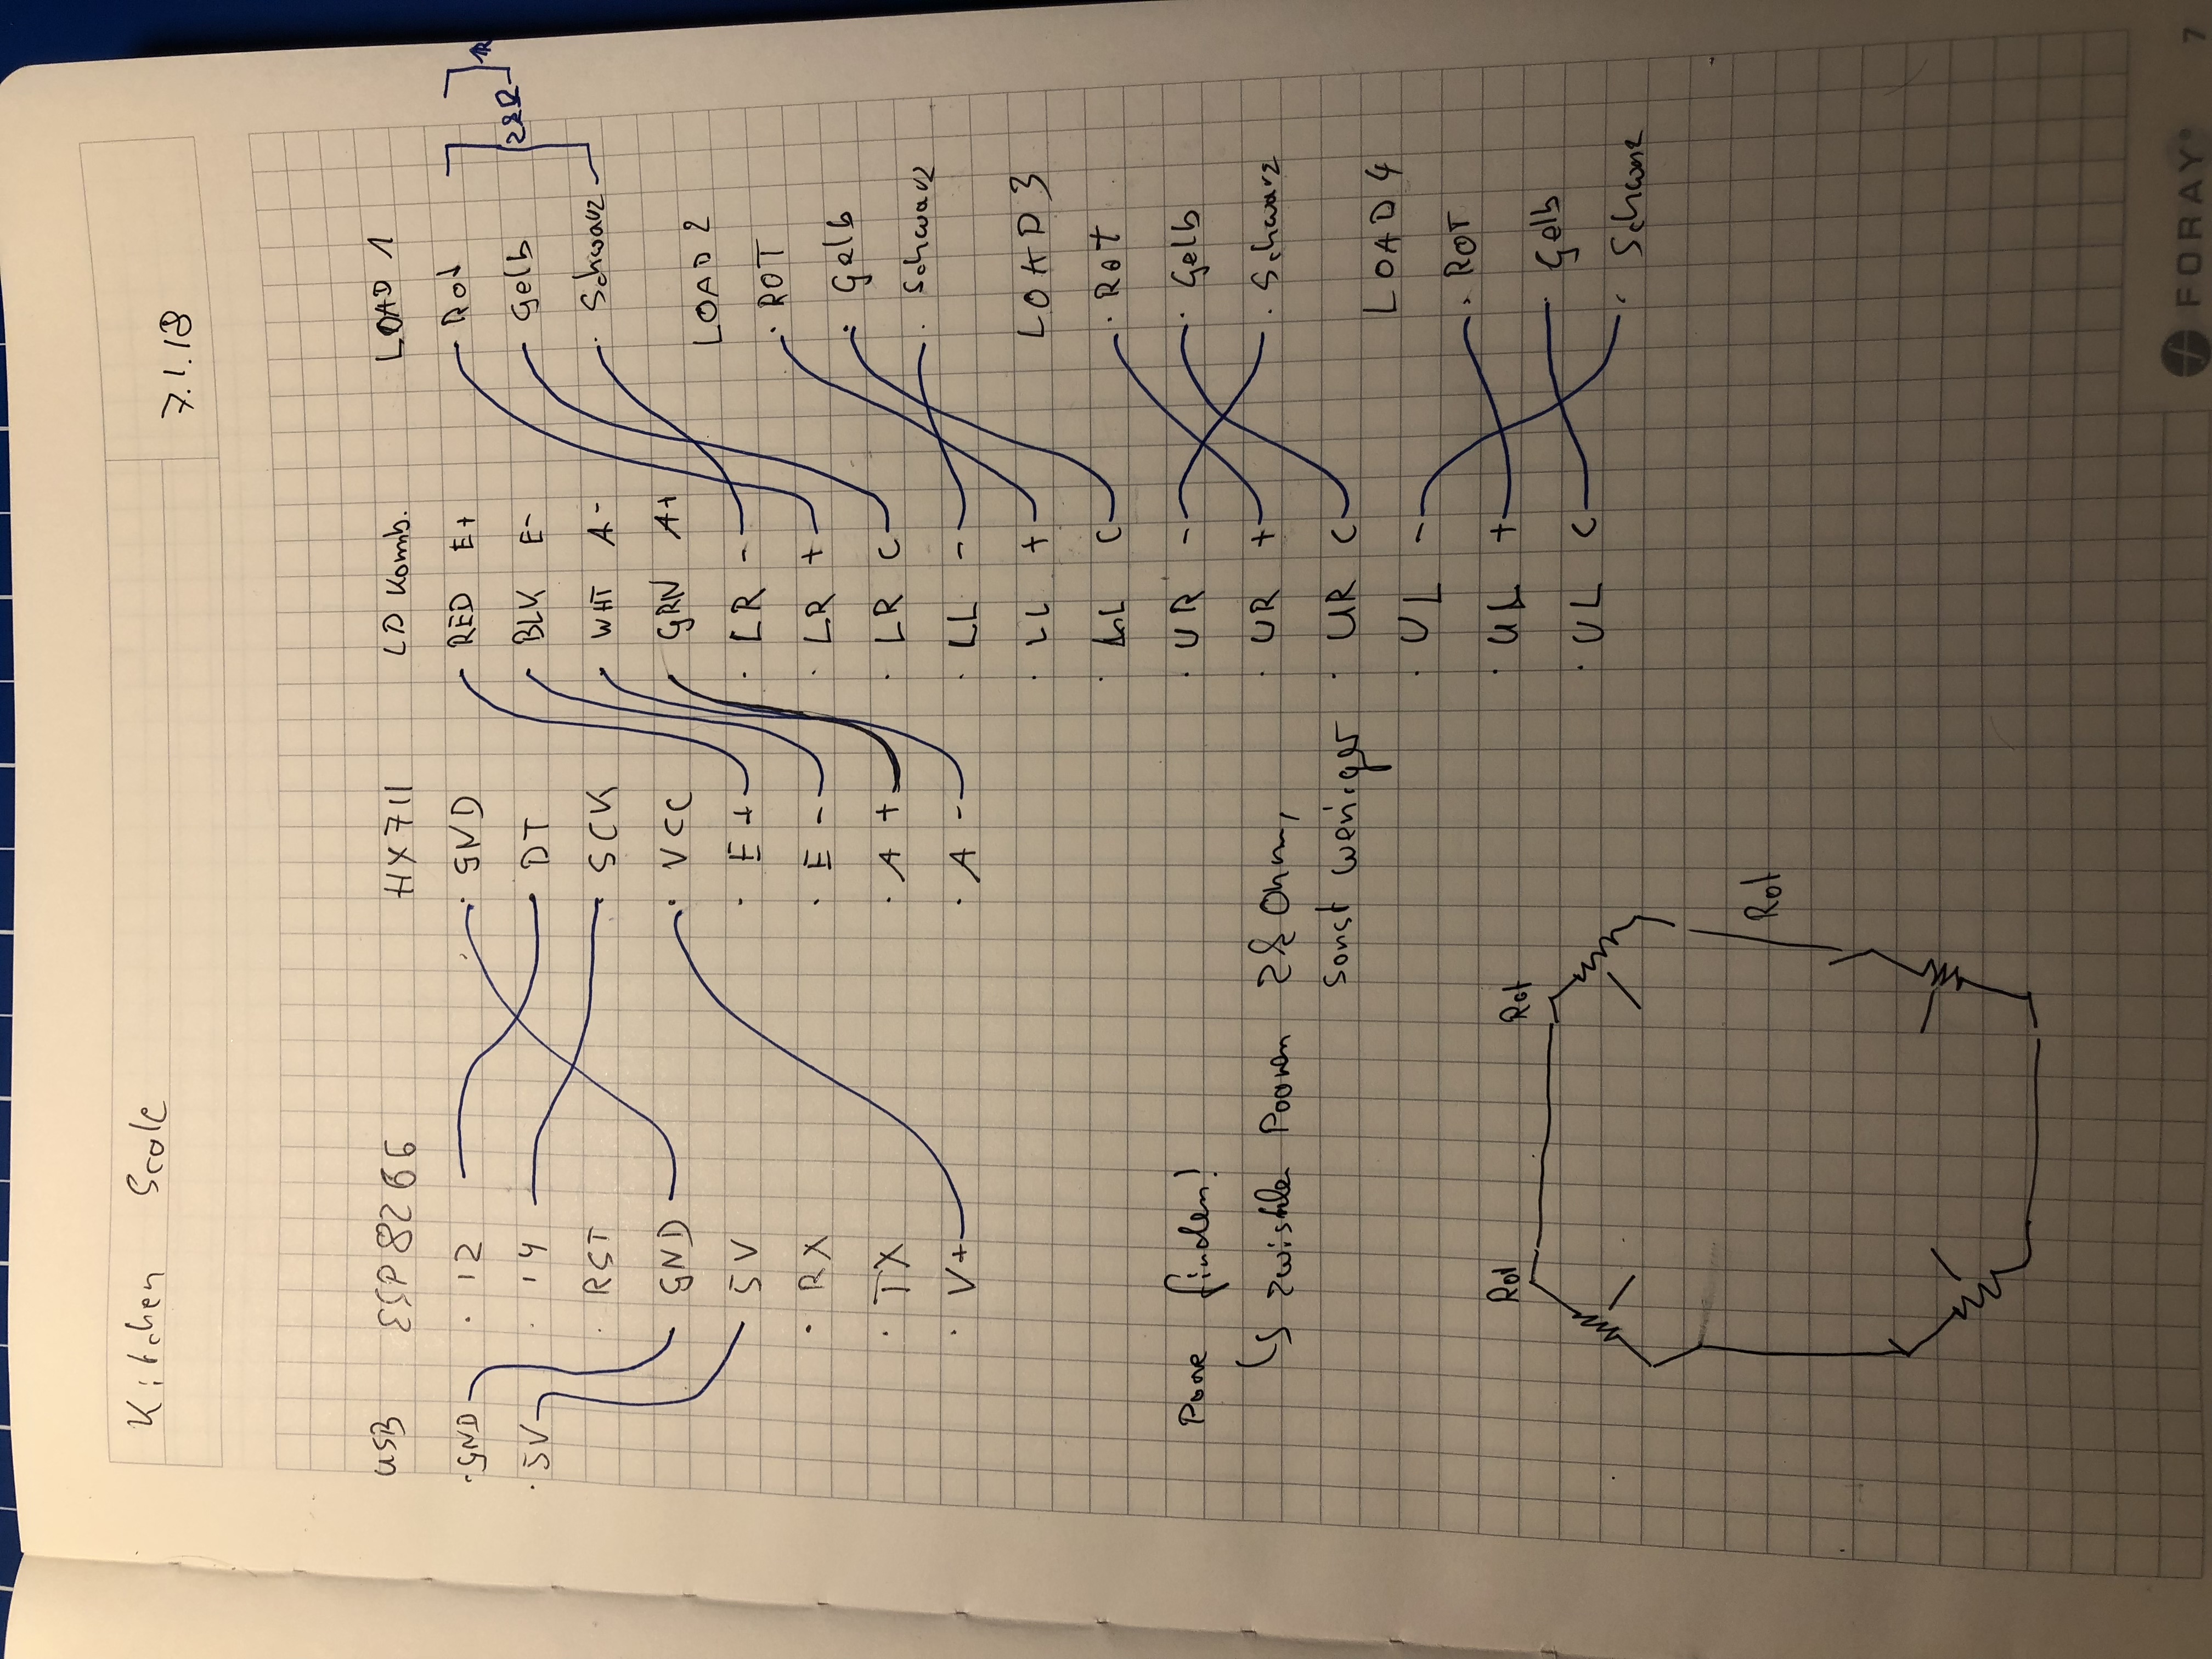
my notes of the wiring… this might be different for your load cells…
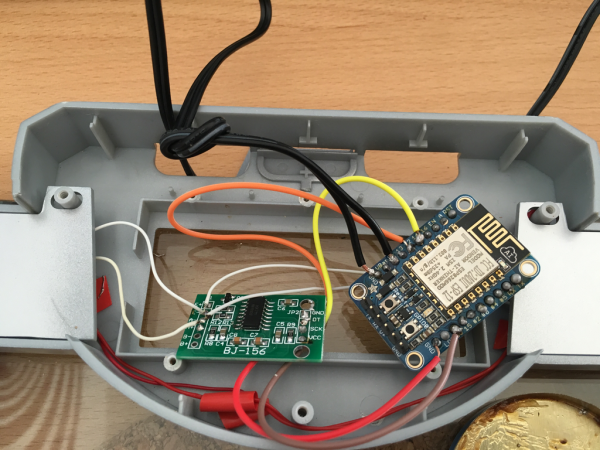
After the hardware portion I sat down and programmed the firmware of the ESP8266. The simple idea: It should connect to wifi and to the house MQTT broker.
It would then send it’s measures into a /raw topic as well as receive commands (tare, calibration) over a /cmd topic.
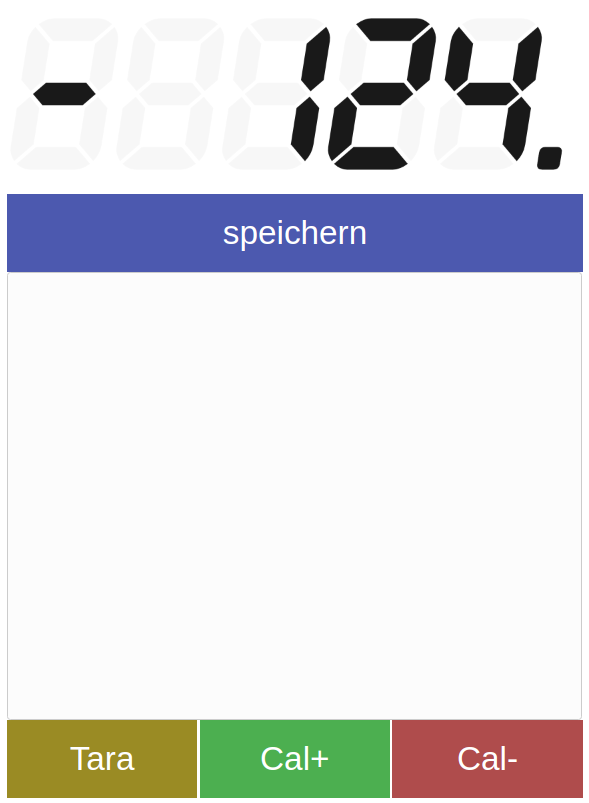
Now the next step was to get the display of the measured weights sorted. The idea for this: write a web application that would connect to the MQTT brokers websocket and receive the stream of measurements. It would then add some additional logic like a “tare” button in the web interface as well as a list of recent measurements that can be stored for later use.
An additional automation would be that if the tare button is pressed and the weight is bigger than 10g the weight would automatically be added to the measurements list in the web app – no matter which of the tare buttons where used. The tare button in the web app or the physical button on the actual scale. Very practical!
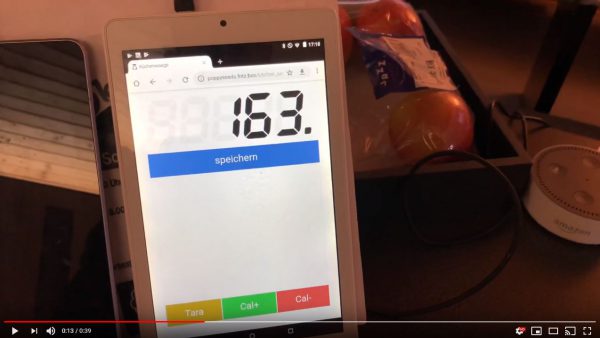
Here’s a short demo of the logic, the scale and the web app in a video:
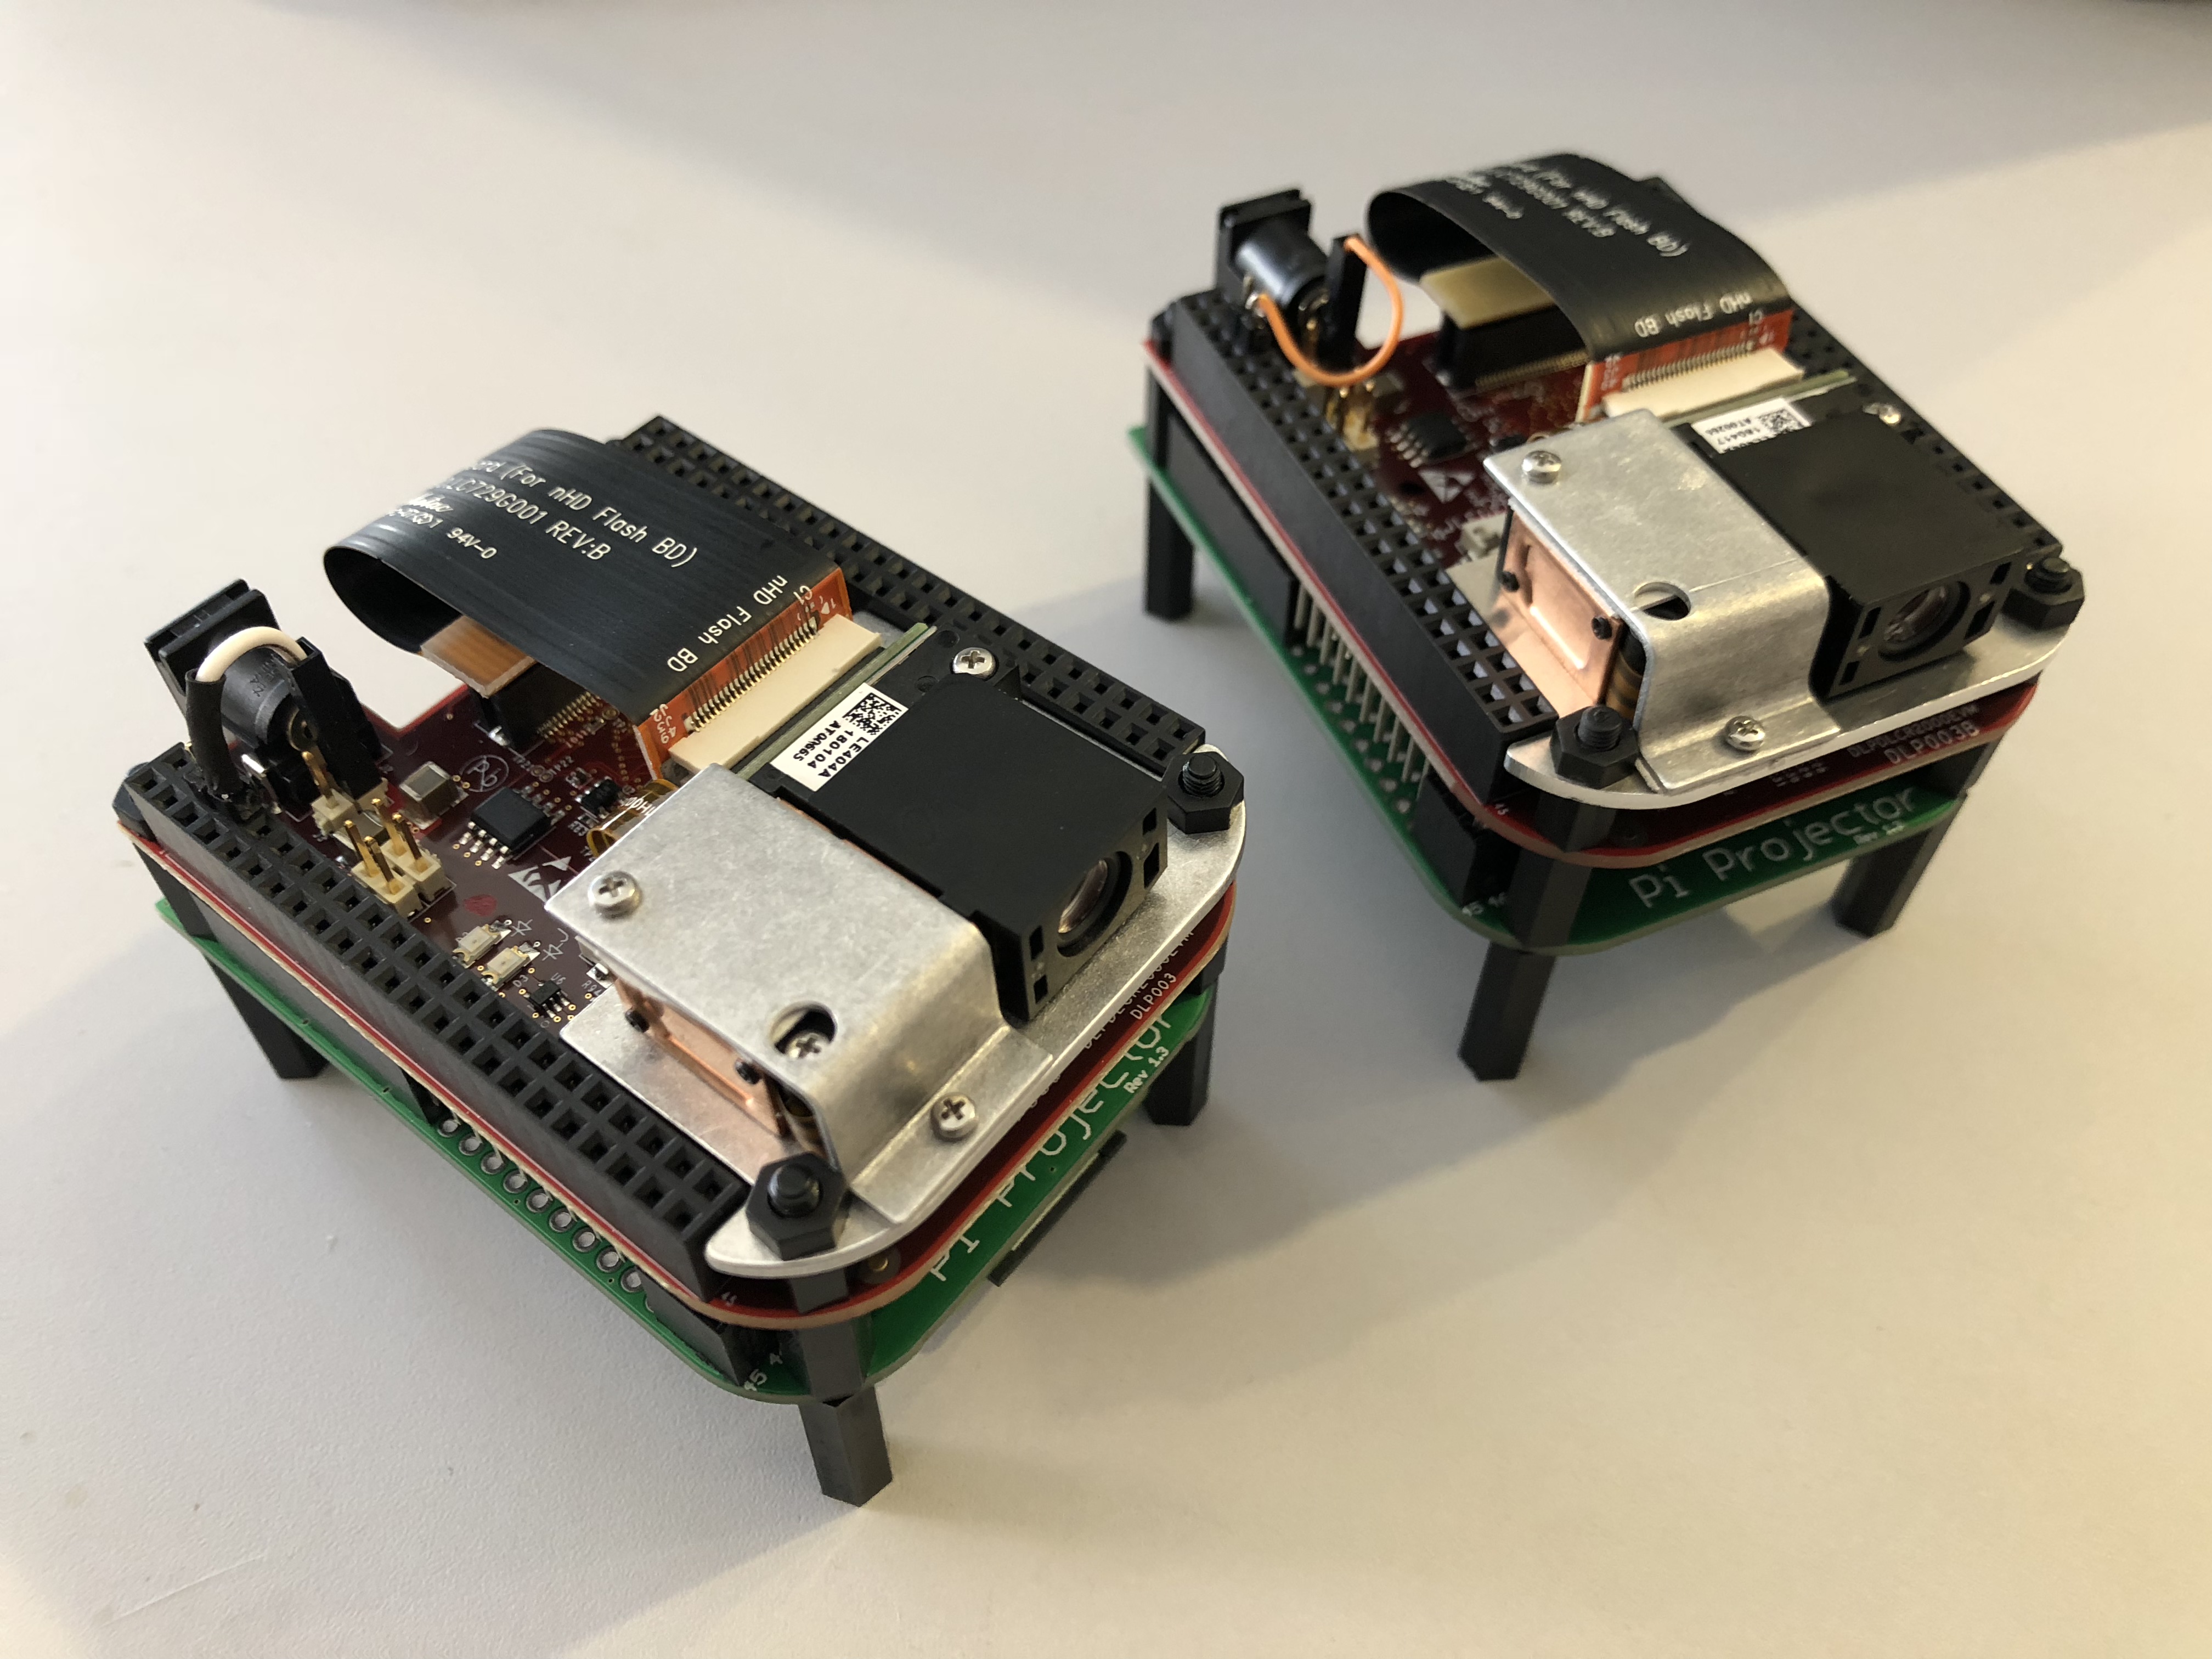
In 2017 Texas Instruments had released a line of cheap industry grade LED projectors meant to be used in production lines and alike:
DLP® LightCrafter Display 2000 is an easy-to-use, plug-and-play evaluation platform for a wide array of ultra-mobile and ultra-portable display applications in consumer, wearables, industrial, medical, and Internet of Things (IoT) markets. The evaluation module (EVM) features the DLP2000 chipset comprised of the DLP2000.2 nHD DMD, DLPC2607 display controller and DLPA1000 PMIC/LED driver. This EVM comes equipped with a production ready optical engine and processor interface supporting 8/16/24-bit RGB parallel video interface in a small-form factor.
After I had learned about the existence of those small projectors I had to get a couple and try for myself. There would be so many immediate and potential applications in our house.
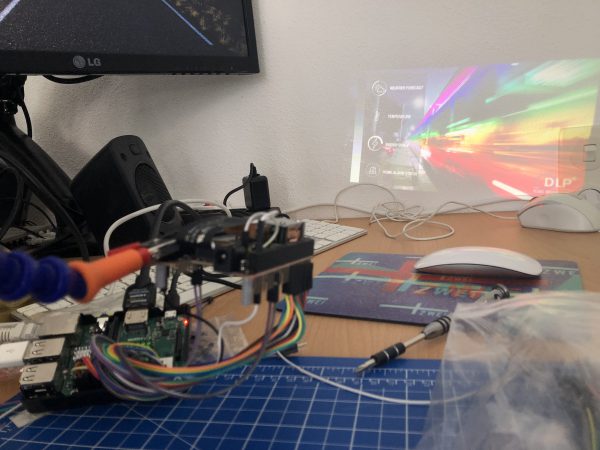
2x DLPLDCR2000EVM with MickMake adapter and RaspberryPi Zero W
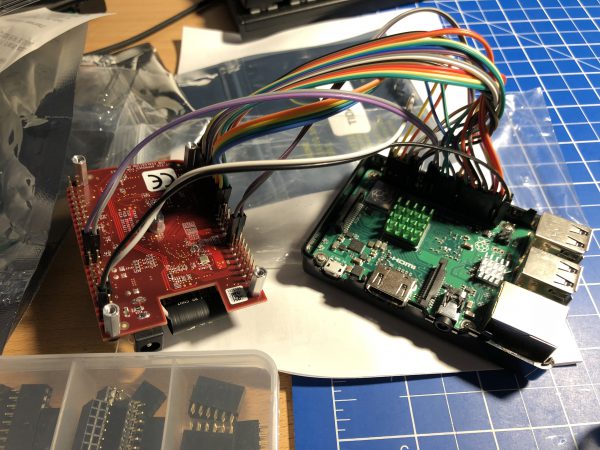
After having them delivered I did the first trial with just a breadboard and the Raspberry Pi 3.
first light!
The projector module has a native resolution of 640×360 – so not exactly high-pixel-density. And of course if the image is projected bigger the screen-door effect is quite noticeable. Also it’s not the brightest of images depending on the size. For the usual use-cases the brightness is definitely sufficient.
Downsides
too low brightness for large projection size – no daylight projection
low resolution is an issue for text and web content – it is not so much of an issue for moving pictures as you might think. Video playback is well usable.
flimsy optics that you need to set focus manually – works but there is no automatic focus or alike.
Upsides
very low powered – 2.5A/5V USB power supply is sufficient for Pi Zero + Projector on full brightness (30 lumen)
low brightness is not always bad – one of our specific use cases requires an as dim as possible image with fine grain control of thr brightness which this projector has.
extremely small footprint / size allows to integrate this device into places you would not have thought of.
almost fully silent operation – the only moving part that makes a sound is the color wheel inside the DLP module. You have to put your ear right onto it to hear anything.
passive cooling sufficient – even at full brightness an added heat sink is enough to dissipate the heat generated by the LED.
So what are these use cases that require such a projector you ask?
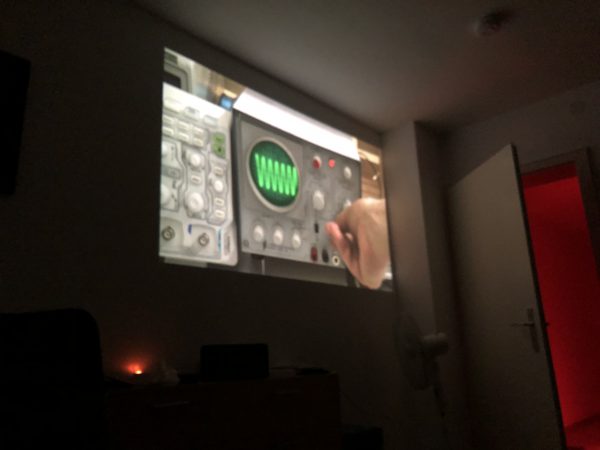
Night status display:
For the last 20+ years I am used to sleep with a “night playlist” running. So far a LED TV was used at the lowest brightness possible. Still it was pretty bright. The projector module allows to dim the brightness down to almost “moon brightness” and also allows to adjust the color balance towards the reds. This means: the perfect night projection is possible! And the power consumption is extremely low. A well watchable lowest brightness red-shifted image also means much lower temperatures on the projector module – it’s crazy how low powered, low temperature.
at 75% brightness (camera did not properly focus…)
Season Window Projection:
Because the projector is small, low-powered and bright enough for back-lit projection we tried and succeeded with a Halloween window projection scene the last season.
outside view
inside view
It really looks funky from the outside – funky enough to have several people stop in front of the house and point fingers. All that while power consumption was really
House overall status projections:
When projecting information is that cheap and power efficient it really shines when used to display overall status information like house-alarm status, general switch maps, locations of family members and so on. I’ve left those to your imagination as these kind of status displays are more or less giving away a lot of personal information that isn’t well suited for the internet.
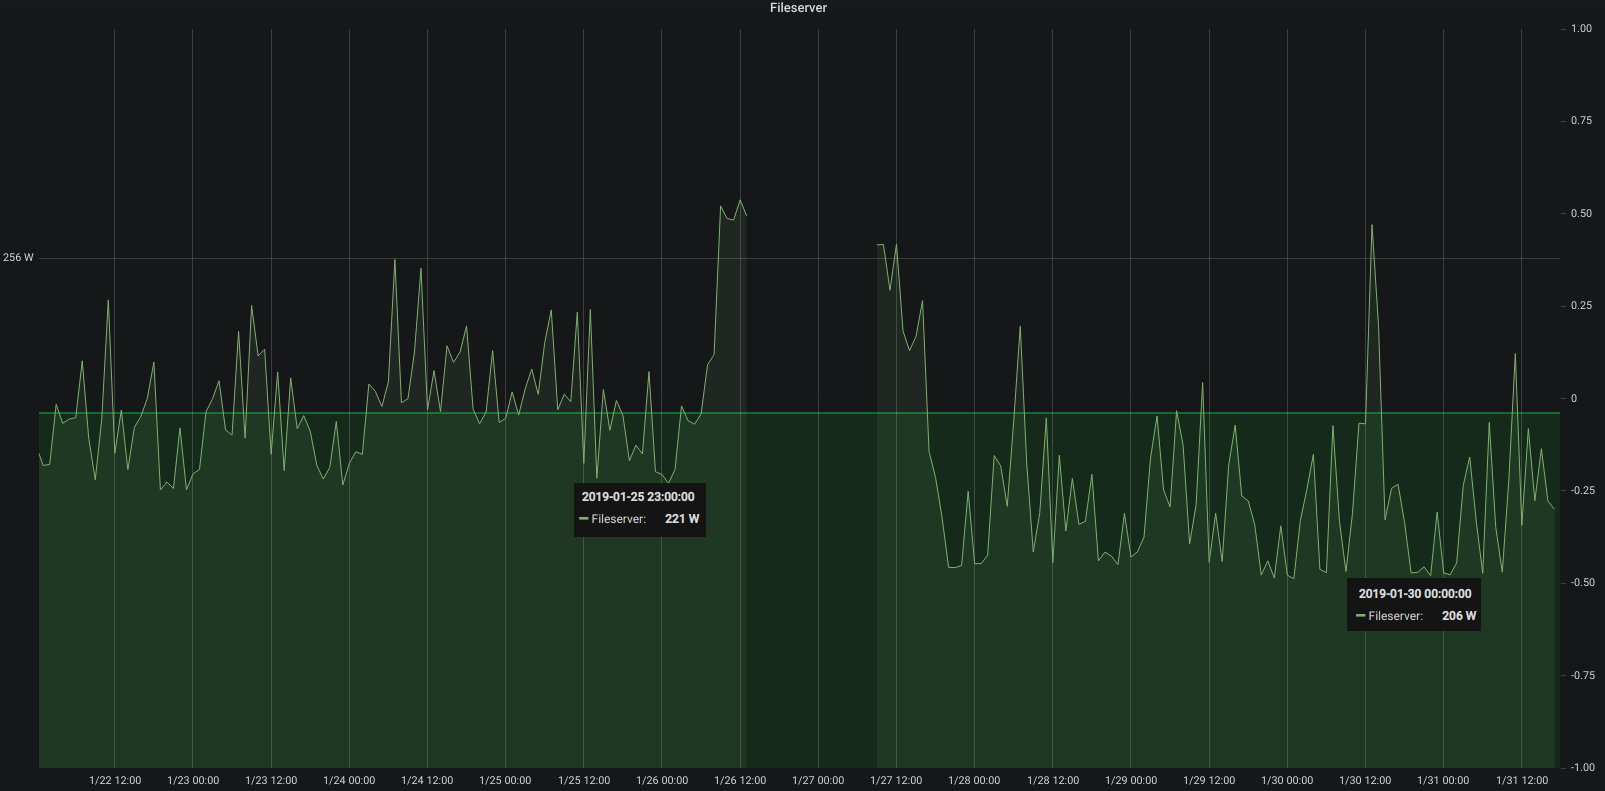
A week after swapping out mechanical hard drives for SSDs it’s time to look at what it meant in the longer run for the power consumption of the server.
15 watt less at least
Depending on what the server is asked to do – high or low cpu load and so on – the power consumption fluctuates but it’s very visible that the averages are about 15 watt lower at all times. Great!
A week ago I had written about another mechanical hard drive that was about to bite the dust in our houses elaborate set-up.
Not having time for a full-day-of-focus I postponed the upgrade to this saturday. With the agreement of the family as they are suffering through the maintenance period as well.
The upgrade would need cautious preparation in order to be doable in one sitting. And this was also meant to be some sort of disaster-recovery-drill. I would restore the house central docker and service infrastructure from scratch along this.
And this would need to happen:
all services, zfs pools, docker containers, configurations needed to be double checked for full backup – as this would be used to restore all (ZFS snapshots are just the bomb for these things!)
the main central docker server would have to go down
get a fresh Ubuntu 18.04 LTS set-up and booting from ZFS on a NVMe SSD (bios update(s)!, secure boot disabling, ahci enabling, m.2 instead of sata express switching…you get the idea)
get the network set-up in order: upgrading from Ubuntu 16.04 to 18.04 means ifupdown networking was replaced by netplan. Hurray! Not.
get docker-ce and docker-compose ready and set-up and all these funky networkings aligned – figure out in this that there are major issues with IPv6 in docker currently.
pull in the small number of still needed mechanical hard disks and import the ZFS pools
start the docker builds from the backup (one script \o/)
start the docker containers in their required order (one script \o/)
Apart from some hardware/bios related issues and the rather unexpected netplan introduction everything went fairly good. It just takes ages to see data copied.
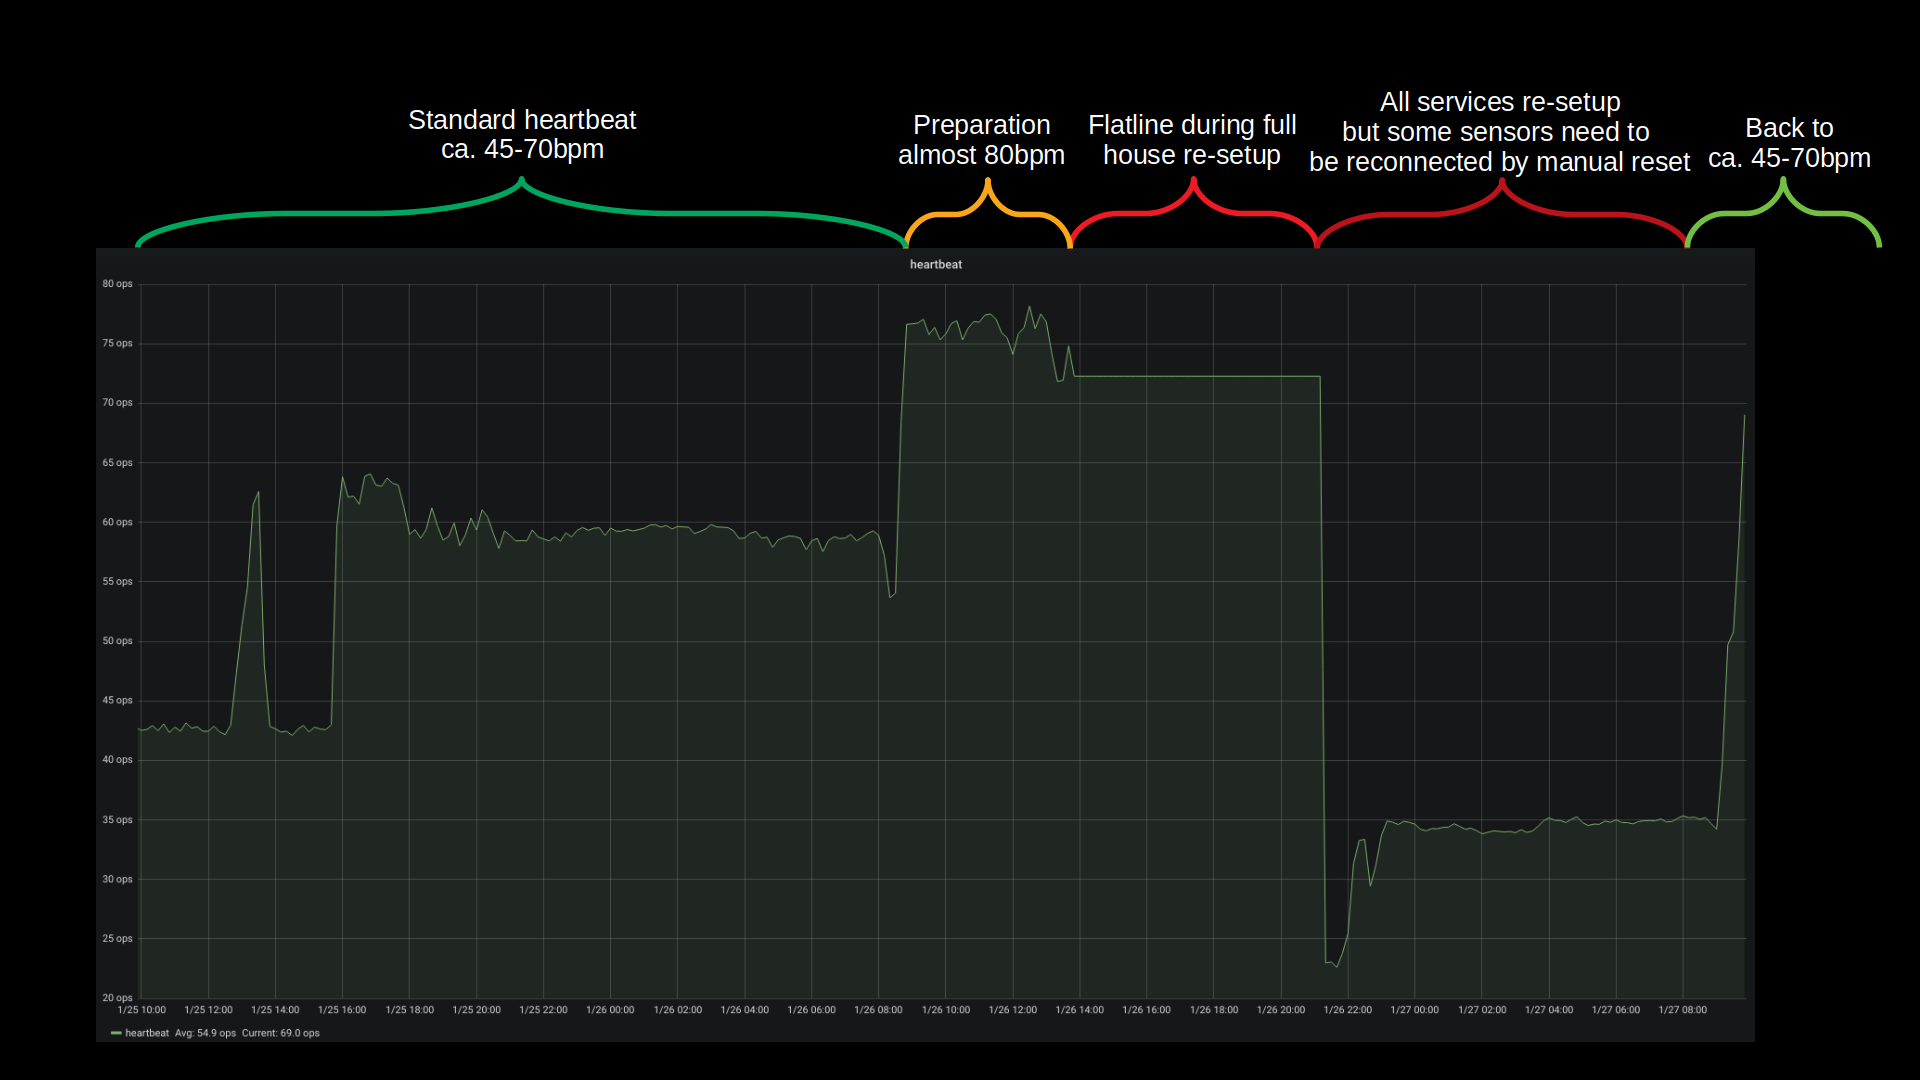
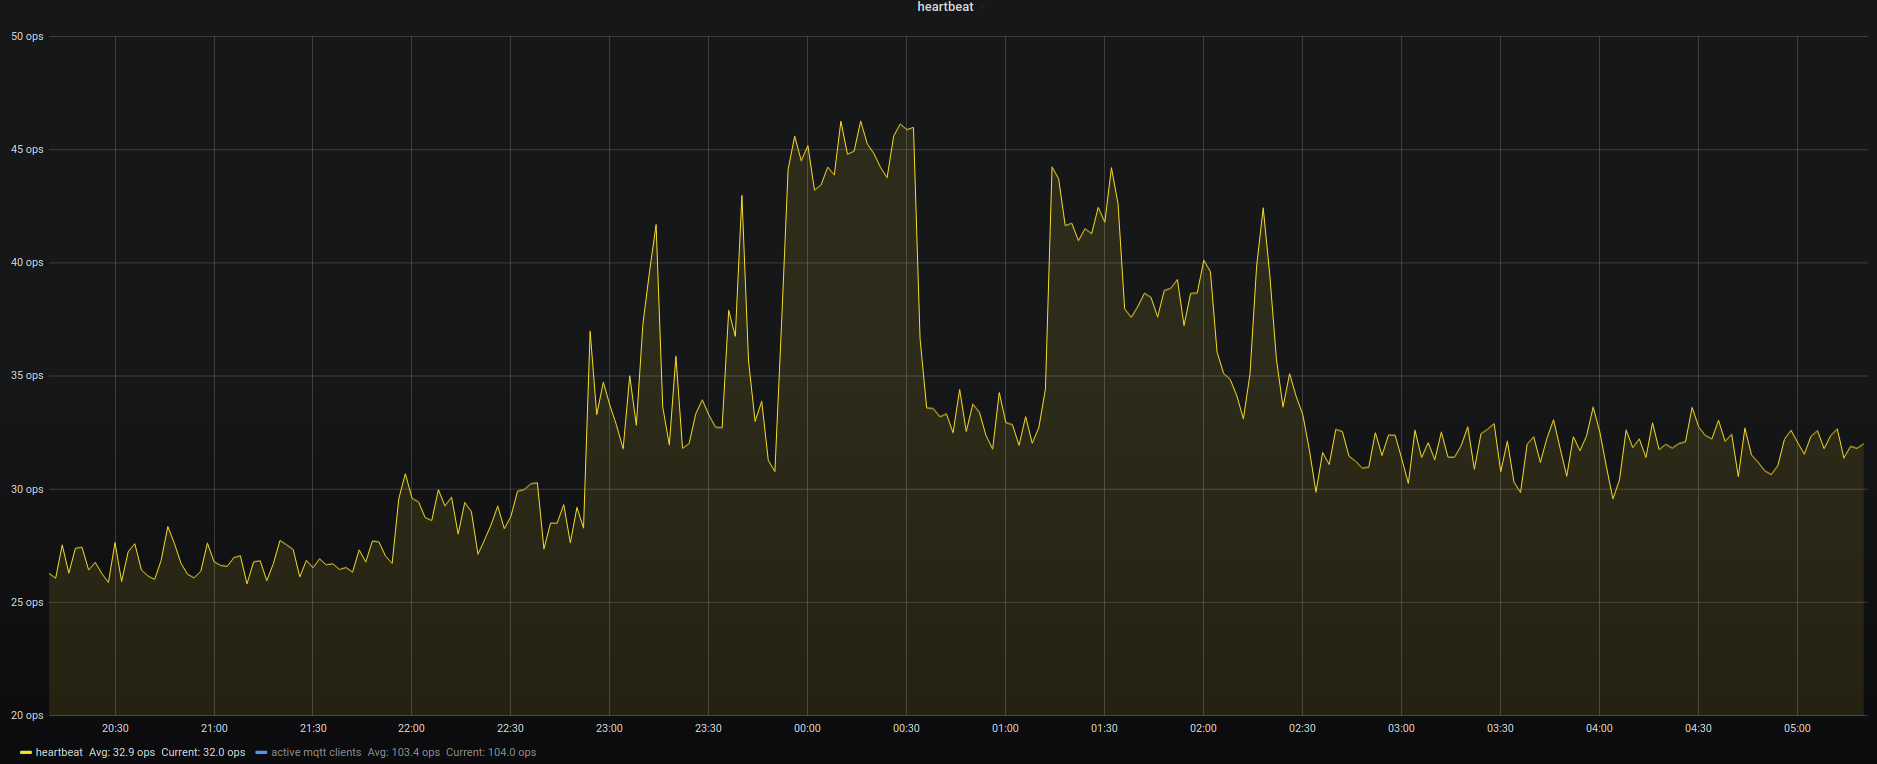
the “heartbeat” is a general term in our house for busy everything is. It’s an artificial value calculated from sensor inputs/s and actions taken and so on. Good indication if there are issues. During the time of maintenance (organge/red) it hasn’t been updated and was stuck at the pre-given value.
Bandwidth was the only real issue with this disaster recovery. All building blocks seemed to fall into place and no unplanned measure had to be taken. The house systems went partially down at around 12:30 and were back up 10 hours later 22:00. Of course non-automated things like internet kept working and all switches were only manual push-buttons. So everything could be done still but with a lot less convenience.
All in all there are more than 40 vital docker container based services that get started one after the other and interconnect to deliver a full house home automation. With the added SSD performance this whole ship is much much more responsive to activities. And hopefully less prone to mechanical defects.
Backup and Disaster-Preparations showed to be practical and working well. There was no beat missed (except sensor measure values during the 10 hours downtime) and no data lost.
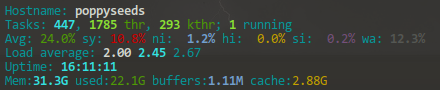
Core i3 with 3.7 Ghz and 32 Gbyte RAM is sufficient and tuned for power consumption
What could be done better: It could be much more straight forward when there were less dependencies on external repositories / docker-hub. Almost all issues that came up with containers where from the fact that the maintainers had just a day before introduced something that kept them from spinning up naturally. Bad luck. But that can be helped! There’s now a multi-page disaster-recovery-procedure document that will be used and updated in the future.
Oh and what speeds am I seeing? The promissed 3 Gbyte/s read and write speeds are real. It’s quite impressive to see 4-digit megabyte/s values in iotop frequently.
I almost forgot! During this exercise I had been in the server room less than 30 minutes. But I was on a warm and nice work-desk set-up I am using in the house as much as I can – and I will tell you about it in another article. But the major feature of this work-desk set-up is that it is (a) a standing desk and (b) has a treadmill under it. Yes. Treadmill.
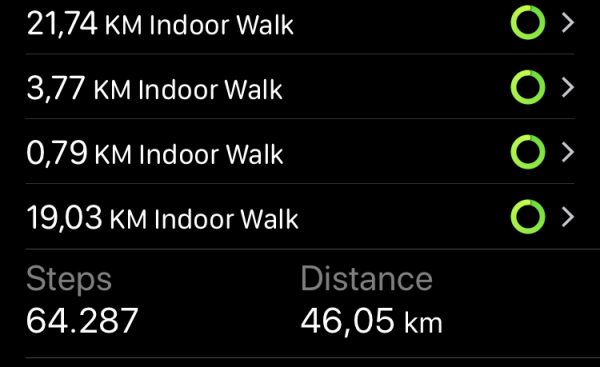
You will get pictures of the set-up in that mentioned article, but since I had spent more than 10 hours walking on saturday doing the disaster recovery I want to give you a glimpse of what such a set-up means:
This project uses the same approach that I took for my ESP32 based indoor location tracking system (by tracking BLE signal strength). But this project came up with an actual user interface – NICE!
“Indoor positioning of a moving iBeacon, using trilateration and three ESP32 development modules. ESP32 modules report all beacons they see, to MQTT topic. Dashboard subscribes to this topic, and shows the location of beacons which are seen by all three stations.” (https://github.com/jarkko-hautakorpi/iBeacon-indoor-positioning-demo)
At our house I am running a medium-sized operation when it comes to all the storage and in-house / home-automation needs of the family.
This is done by utilizing several products from QNAP, Synology and a custom built server infrastructure that does most of the heavy-lifting using Docker.
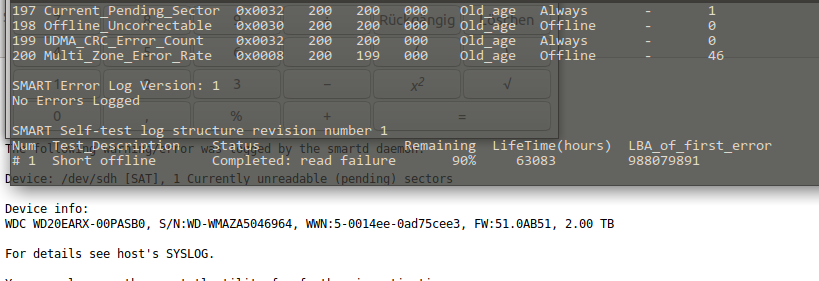
This morning I woke up to an eMail stating that one of the mirrored drives in the machine is reporting read-errors.
Since this drive is part of a larger array of spinning-rust style hard disks just replacing it would work but due to the life-time of those drives I am not particularly interested in more replacing in the very near future. So a more general approach seems right.
63083 lifetime hours = 2628 days = 7.2 years powered up
You can see what I mean. This drive is old. Very old. And so are its mates. Actually this is the newest drive of another 6 or so 1.5TB and 1TB drives in this array.
Since this redundant array in fact is still quite small and not fully used as most storage intensive non service-related disk space demands have moved to iSCSI and other means it’s not the case anymore that so many disks, so well redundant with so little disk space are needed anymore. Actual current space utilization seems about 20% of the available 2TB volume.
Time for an upgrade! Taking a look in the manual of the mainboard I had replaced 2 years ago I found that this mainboard does have dual NVMe m.2 ports. From which I can boot according to that same manual.
So I thought: Let’s start with replacing the boot drives and the /var/lib docker portions with something fast.
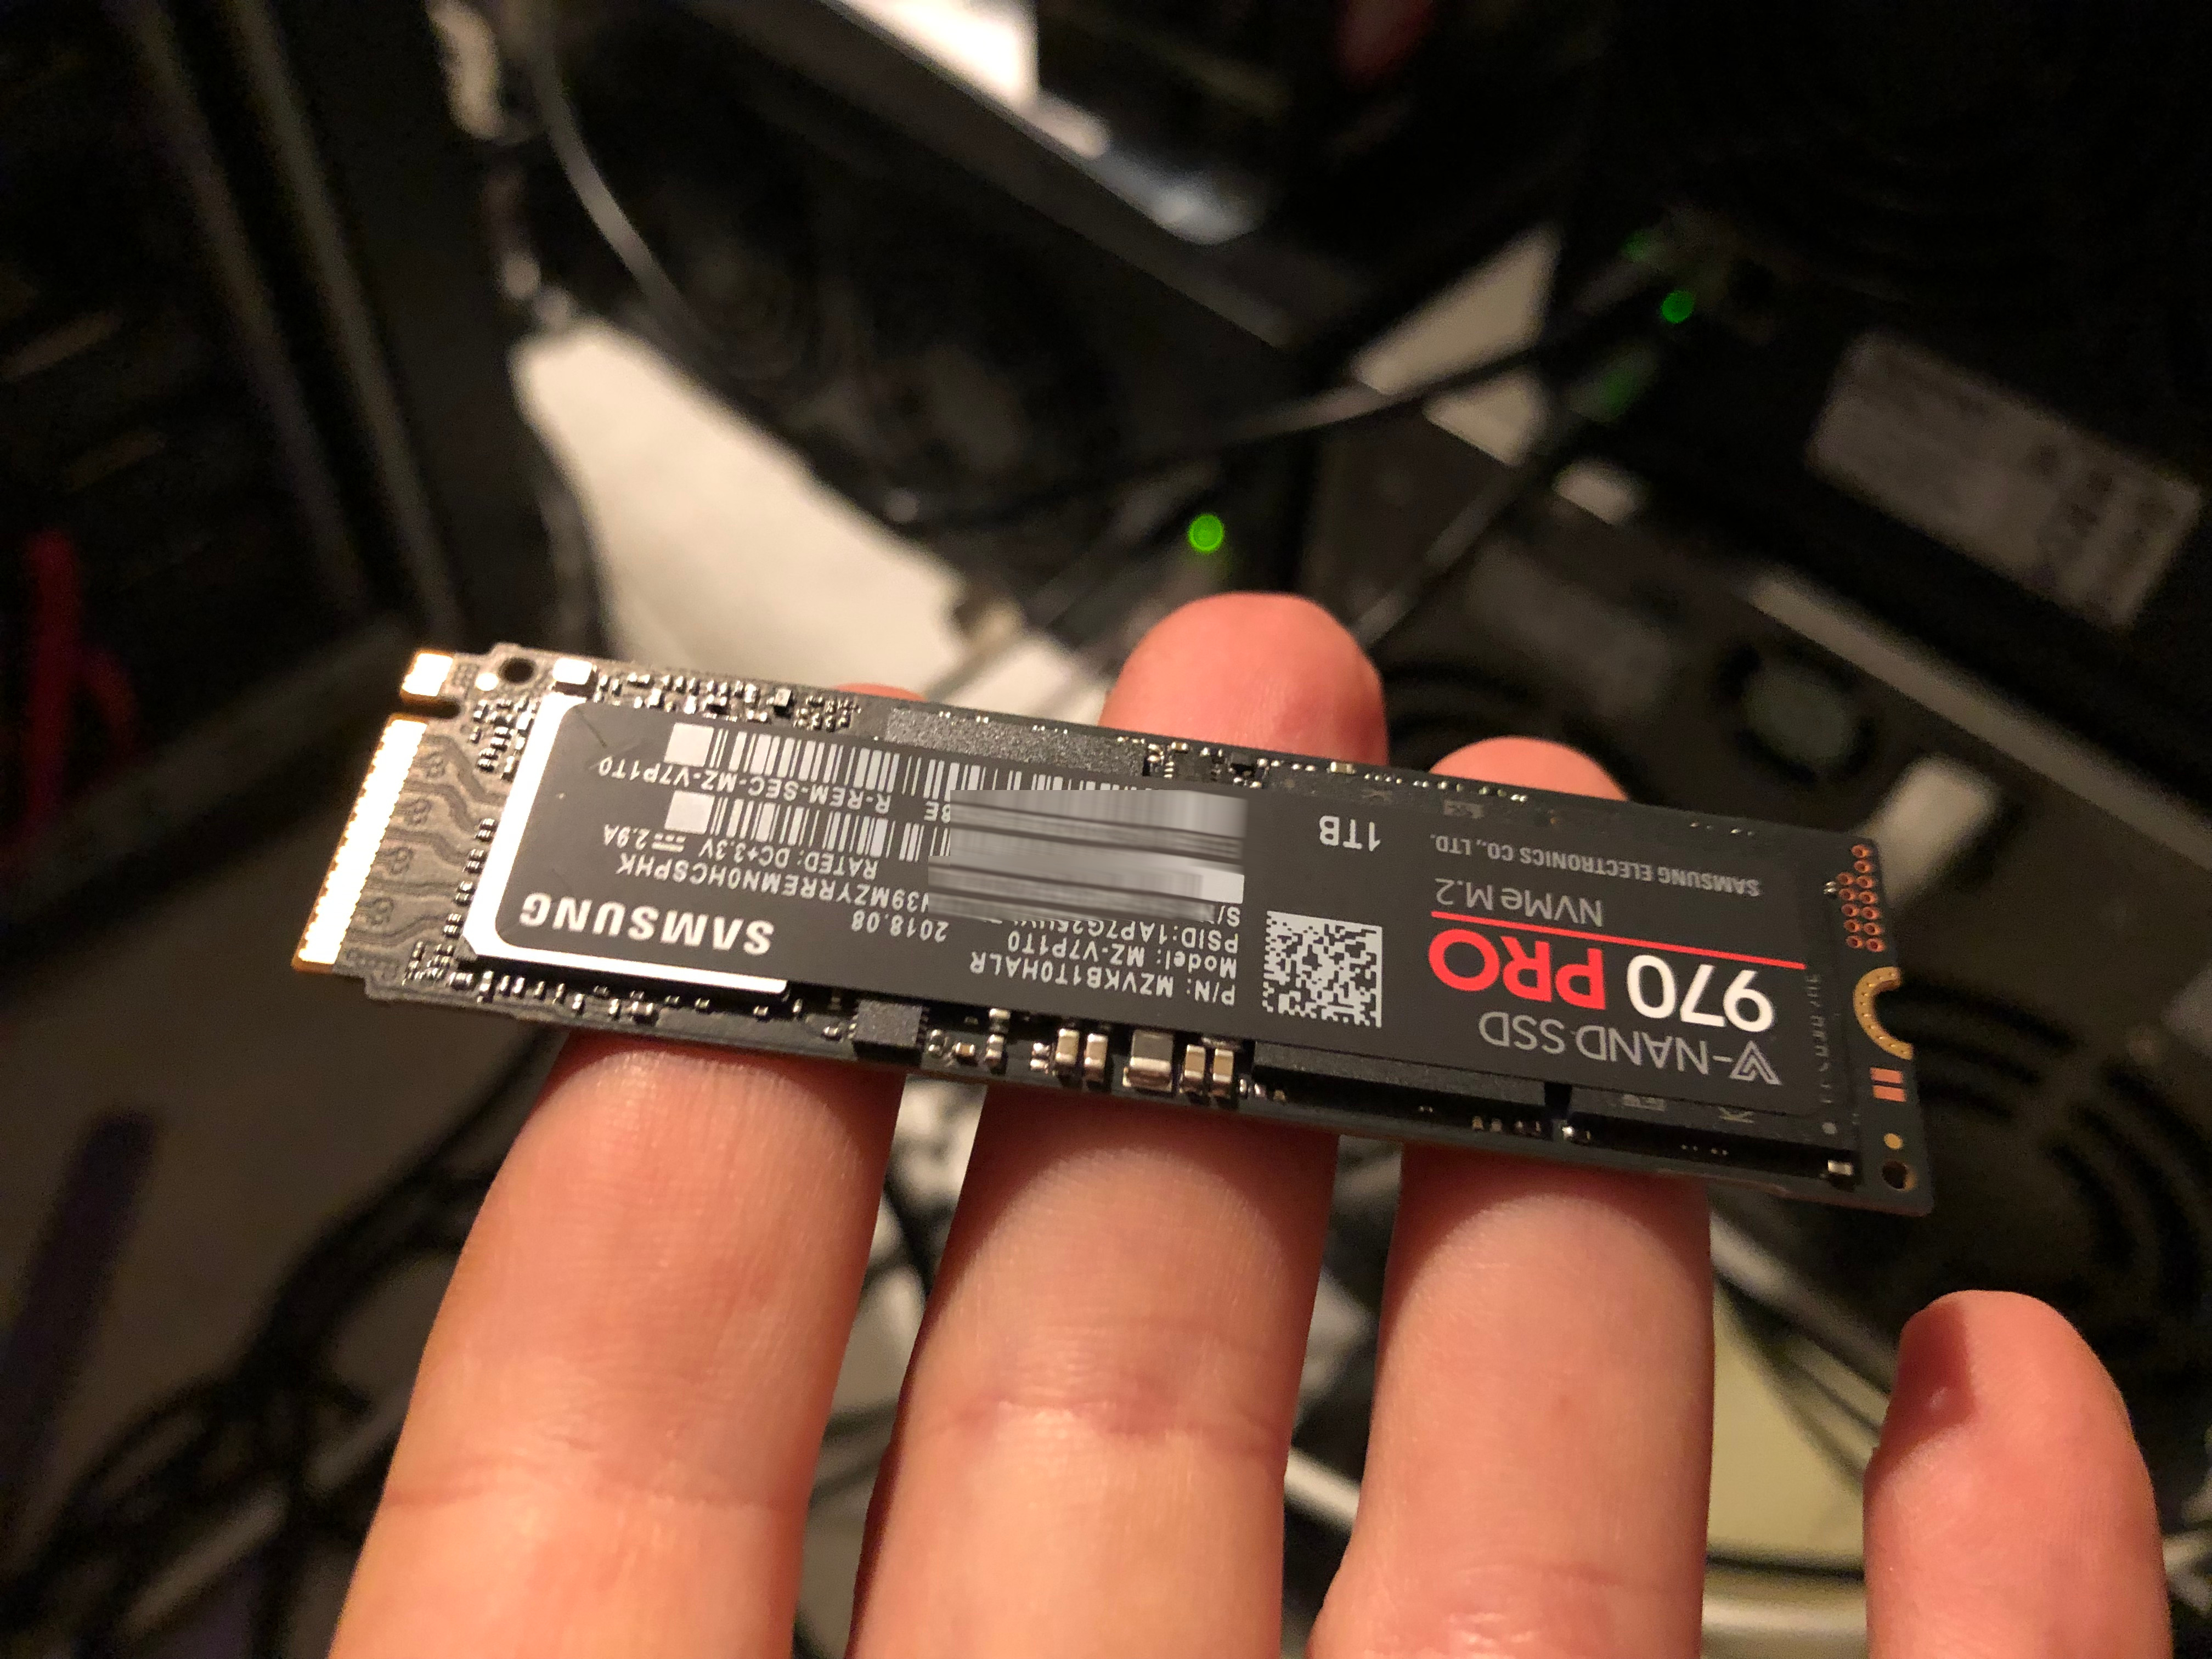
To my surprise Samsung is building 1 TB NVMe M.2 SSDs to a price I expected to be much higher.
Nice! So let me reeport back when this shipped and I can start the re-set-up of the operating system and docker environment. Which by all fairness should be straight forward. I will upgrade from Ubuntu 16.04 LTS to 18.04 LTS in the same step – and the only more complex things I expect to happen is the boot-from-ZFS(on Linux) and iSCSI set-up of the machine.
If you got any tips or best-practice, let me know.
I just have started the catch-up on what happpened in the last 2 years to ZFS on Linux. My initial decision to use Linux 2 years ago as the main driver OS and Ubuntu as the distribution was based upon the exepectation to not have this as my hobby in the next years. And that expectation was fulfilled by Ubuntu 16.04 LTS.


![var complete = {};
var sodium = {};
var carbohydrates = {};
var calories = {};
var daydate = {};
var fat = {};
var sugar = {};
var protein = {};
var weight = {};
var bodyfat = {};
var goalsodium = {};
var goalcarbohydrates = {};
var goalcalories = {};
var goalfat = {};
var goalsugar = {};
var goalprotein = {};
var caloriesdiff = {};
var ttopic = msg.topic.toLowerCase();
var firstobject = Object.keys(msg.payload)[0];
complete.payload = msg.payload[firstobject].complete;
complete.topic = ttopic+'/complete';
sodium.payload = msg.payload[firstobject].totals.sodium;
sodium.topic = ttopic+'/total/sodium';
carbohydrates.payload = msg.payload[firstobject].totals.carbohydrates;
carbohydrates.topic = ttopic+'/total/carbohydrates';
calories.payload = msg.payload[firstobject].totals.calories;
calories.topic = ttopic+'/total/calories';
fat.payload = msg.payload[firstobject].totals.fat;
fat.topic = ttopic+'/total/fat';
sugar.payload = msg.payload[firstobject].totals.sugar;
sugar.topic = ttopic+'/total/sugar';
protein.payload = msg.payload[firstobject].totals.protein;
protein.topic = ttopic+'/total/protein';
weight.payload = msg.payload[firstobject].measurements.weight;
weight.topic = ttopic+'/measurement/weight';
bodyfat.payload = msg.payload[firstobject].measurements.bodyfat;
bodyfat.topic = ttopic+'/measurement/bodyfat';
goalsodium.payload = msg.payload[firstobject].goals.sodium;
goalsodium.topic = ttopic+'/goal/sodium';
goalcarbohydrates.payload = msg.payload[firstobject].goals.carbohydrates;
goalcarbohydrates.topic = ttopic+'/goal/carbohydrates';
goalcalories.payload = msg.payload[firstobject].goals.calories;
goalcalories.topic = ttopic+'/goal/calories';
goalfat.payload = msg.payload[firstobject].goals.fat;
goalfat.topic = ttopic+'/goal/fat';
goalsugar.payload = msg.payload[firstobject].goals.sugar;
goalsugar.topic = ttopic+'/goal/sugar';
goalprotein.payload = msg.payload[firstobject].goals.protein;
goalprotein.topic = ttopic+'/goal/protein';
caloriesdiff.payload = msg.payload[firstobject].goals.calories - msg.payload[firstobject].totals.calories;
caloriesdiff.topic = ttopic+'/caloriedeficit';
daydate.payload = firstobject;
daydate.topic = ttopic+"/date";
return [complete, sodium, carbohydrates, calories, fat, sugar, protein, weight, bodyfat, goalsodium, goalcarbohydrates, goalcalories, goalfat, goalsugar, goalprotein, daydate, caloriesdiff];](https://www.schrankmonster.de/wp-content/uploads/2019/03/Bildschirmfoto-zu-2019-03-22-14-13-41.png)