An Introduction to D3.js

Browsers can do many things. It’s probably your main window into the vast internet. Lots of things need visualization. And if you want to know how it’s done, maybe do one yourself, then…

D3.js is a JavaScript library for manipulating documents based on data. D3 helps you bring data to life using HTML, SVG, and CSS. D3’s emphasis on web standards gives you the full capabilities of modern browsers without tying yourself to a proprietary framework, combining powerful visualization components and a data-driven approach to DOM manipulation.

D3.js

And to further learn what it’s all about, go to Amelia Wattenbergers blog and take a stroll:

So, you want to create amazing data visualizations on the web and you keep hearing about D3.js. But what is D3.js, and how can you learn it? Let’s start with the question: What is D3?

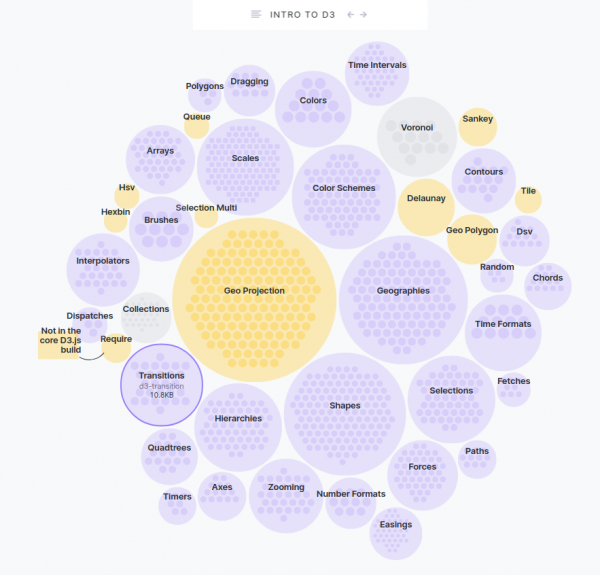
While it might seem like D3.js is an all-encompassing framework, it’s really just a collection of small modules. Here are all of the modules: each is visualized as a circle – larger circles are modules with larger file sizes.

An Introduction to D3.js

generate web-ready graphs and data visualizations without coding

Plot.ly is both a well known software library of impressive visualizations and a company providing software and know-how around visualizations.

With the libraries requiring a fair amount of know-how and programming to be useful to everyone there is now seemingly a multitude of tools that wraps the powers of the library and provides a great online-/web-browser experience to create impressive visualizations:

The access path to this quite powerful tool does somehow not be very easily found. So I am linking to it for your and my later reference.

technical visualization tools

There’s so much happening in this field as visualizations become more powerful and easier to create.

WaveDrom

WaveDrom draws your Timing Diagram or Waveform from simple textual description. It comes with description language, rendering engine and the editor.

WaveDrom editor works in the browser or can be installed on your system. Rendering engine can be embeded into any webpage.

https://wavedrom.com/

MermaidJS

Generation of diagrams and flowcharts from text in a similar manner as markdown.

Ever wanted to simplify documentation and avoid heavy tools like Visio when explaining your code?

This is why mermaid was born, a simple markdown-like script language for generating charts from text via javascript. Try it using our editor.