For over 2 years now my preferred local supermarket offers an electronic receipt for each purchase.
With a „little bit of data sharing“ signed-off just about a couple of seconds after you paid your purchase a PDF file of the receipt you would have gotten at the cashier is in your eMail inbox.
That receipt is a fairly small PDF file looking just like the paper-receipt would have looked like. Additionally you can opt out of the paper receipt – which means less wasted paper as it‘s not even printed out at the cashir.
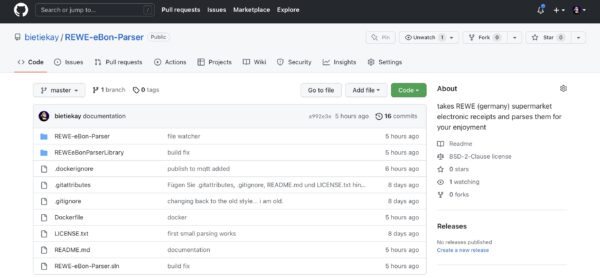
I had accumulated two years of groceries shopping – over 100 receipts until I finally sat down and coded a parser that takes the pdf-receipt, parses it and publishes the results to respective MQTT topics.
When you start the program this way it’ll go through all pdf files in the directory you point it at. If it finds REWE eBons it will read and parse them in.
It will then order the eBons by date and output all of them in the correct timely order to MQTT.
Then it will start watching the directory for any changes and new files. It’ll pick up those files automatically, read them in and send the data to MQTT of the receipt date is newer than the last one seen and sent.
I‘ve wrapped all of it so it would come with a Dockerfile and can be run anywhere where you‘ve got docker up and running.
Now what do I do with this you may ask?
Let me show you an example:
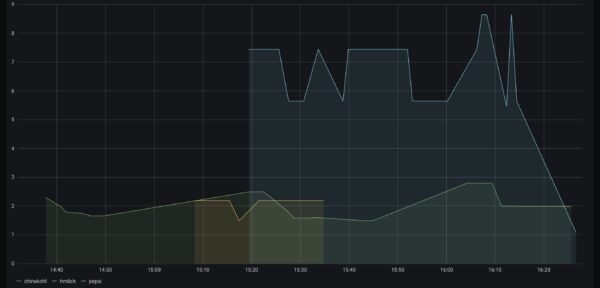
How I use this is: the tool is running all the time and watching a directory. Whenever a new .PDF file shows up in this directory it will automatically be parsed and it‘s contents pushed out through MQTT. Each item essentially in it‘s own separate topic with price, quantities etc.
Using a combination of Telegraf (to get the data from MQTT to InfluxDB) and InfluxDB (to store time-series) and Grafana (to query and show graphs).
This way it‘s trivial to plot the price development of groceries you regularly purchase. It‘s easy to see what you might have missed.
I am still drilling into the data and there‘s lots of things you can do with it.