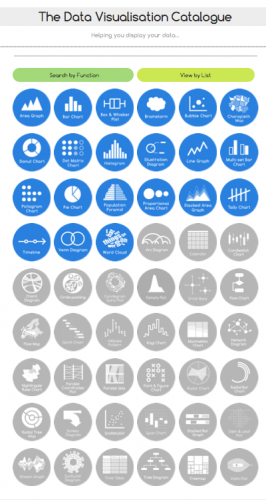
“The Data Visualisation Catalogue is currently an on-going project developed by Severino Ribecca.
Originally, this project was a way for me to develop my own knowledge of data visualisation and create a reference tool for me to use in the future for my own work. However, I thought it would also be useful tool to not only other designers, but also anyone in a field that requires the use of data visualisation regularly (economists, scientists, statisticians etc).
Although there have been a few attempts in the past to catalogue some of the established data visualisation methods, there is no website that is really comprehensive, detailed or helps you decide the right method for your needs.
I will be adding in new visualisation methods, bit-by-bit, as I research each method to find the best way to explain how it works and what it is best suited for.”
Source 1: http://datavizcatalogue.com/

I would like to discuss something about Sones and GraphDB definitely not any technical assistance. It will be very useful if you can communicate in the email provided. Thanks.