proper links when printing out the internet

Cascading Style Sheets or CSS in short are a very powerful tool to control how content is being displayed.

CSS is designed to enable the separation of presentation and content, including layout, colors, and fonts. This separation can improve content accessibility, provide more flexibility and control in the specification of presentation characteristics, enable multiple web pages to share formatting by specifying the relevant CSS in a separate .css file, and reduce complexity and repetition in the structural content.
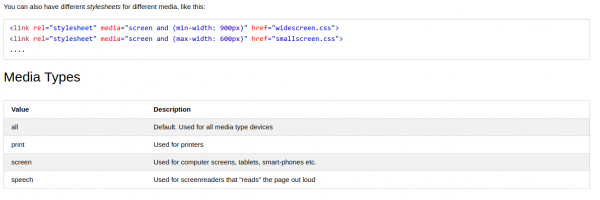
Separation of formatting and content also makes it feasible to present the same markup page in different styles for different rendering methods, such as on-screen, in print, by voice (via speech-based browser or screen reader), and on Braille-based tactile devices. CSS also has rules for alternate formatting if the content is accessed on a mobile device.

Wikipedia

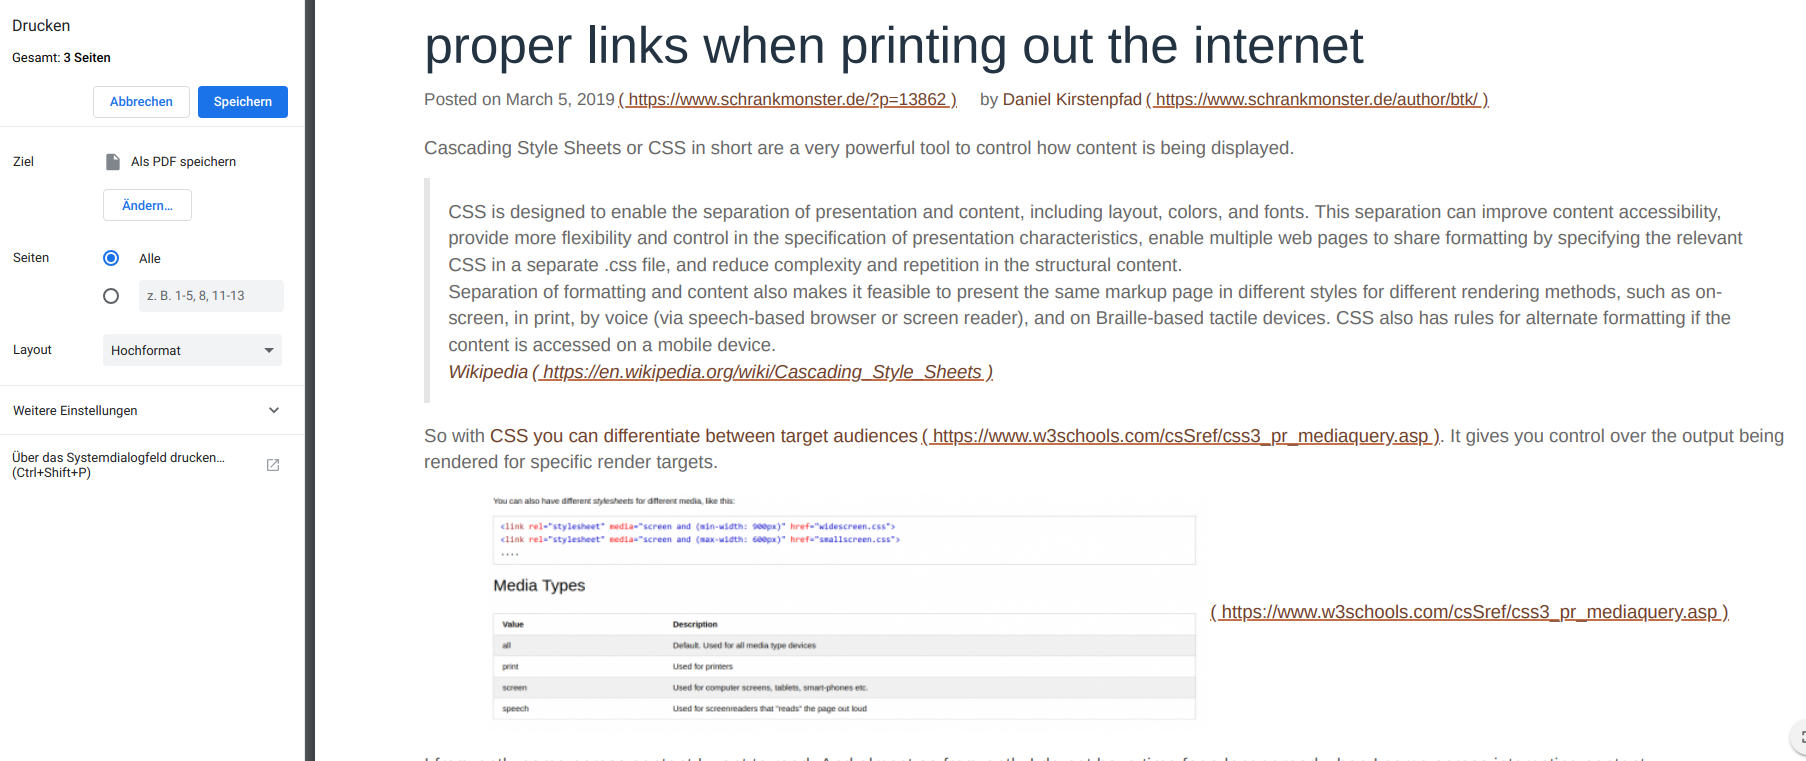
So with CSS you can differentiate between target audiences. It gives you control over the output being rendered for specific render targets.

I frequently come across content I want to read. And almost as frequently I do not have time for a longer read when I come across interesting content.

My workflow for this is: keeping some to-be-read backlog of PDF files I have printed from websites. These PDF files are automatically synced to various devices and I can read them at a later stage.

What often is frustrating to see: bad the print results of website layouts as these websites have not even thought of the remote option of being printed.

With this blog I want to support any workflow and first and foremost my own. Therefore printing this blog adds some print-audience specifics.

For example the links I am using in the articles are usually inline when you are using a browser. When you’re printing the article those links get converted and are being written out with the text. So you can have them in your print-outs without loosing information.

this is how Google Chrome shows you the print preview…

And the changes you need to apply to any webpage to instantly enable this are very simple as well! Just add this to your page stylesheet:
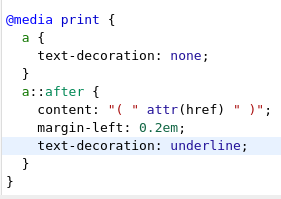
@media print {
a {
text-decoration: none;
}
a::after {
content: "( " attr(href) " )";
margin-left: 0.2em;
text-decoration: underline;
}
}

a new header

I had redone the header of this blog a while ago but since I was trying around some things on the template I wanted something more dynamic but without any additional dependencies.

So I searched and found:

Tim Holman did a very nice implementation of this “worm generator” with only using the HTML5 canvas tag and some math. I made some very slight changes and integrated it into the header graphic. It will react to your mouse movement and resets if you click anywhere. Give it a go!

fonts for your programming needs

We are looking at our screens more and more time of the day and most of that time we are reading or writing text. Text needs to look pretty for our eyes not to get sore – apart from the obvious “being able to tell what letter that is” there is a big portion of personal taste and preference when it comes to the choice of the font.

Most of the texts I am writing benefit from monospaced fonts.

This blog celebrates monospaced fonts for programming.
So many fonts have popped up in recent years.

programmingfonts.org/about

Of course there’s a nice page available that previews the fonts right in your browser:

when you’re working late: grant your eyes a rest

“Ever notice how people texting at night have that eerie blue glow?

Or wake up ready to write down the Next Great Idea, and get blinded by your computer screen?

During the day, computer screens look good—they’re designed to look like the sun. But, at 9PM, 10PM, or 3AM, you probably shouldn’t be looking at the sun.

f.lux fixes this: it makes the color of your computer’s display adapt to the time of day, warm at night and like sunlight during the day.

It’s even possible that you’re staying up too late because of your computer. You could use f.lux because it makes you sleep better, or you could just use it just because it makes your computer look better.”

Bildschirmfoto 2014-09-27 um 12.58.33

Source: https://justgetflux.com/

The Data Visualisation Catalogue

The Data Visualisation Catalogue is currently an on-going project developed by Severino Ribecca.

Originally, this project was a way for me to develop my own knowledge of data visualisation and create a reference tool for me to use in the future for my own work. However, I thought it would also be useful tool to not only other designers, but also anyone in a field that requires the use of data visualisation regularly (economists, scientists, statisticians etc).

Although there have been a few attempts in the past to catalogue some of the established data visualisation methods, there is no website that is really comprehensive, detailed or helps you decide the right method for your needs.

I will be adding in new visualisation methods, bit-by-bit, as I research each method to find the best way to explain how it works and what it is best suited for.”

Bildschirmfoto 2014-03-29 um 13.11.59

Source 1: http://datavizcatalogue.com/

Automated Picture Tank and Gallery for a photographer

Since my wife started working as a photographer on a daily basis the daily routine of getting all the pictures off the camera after a long day filled with photo shootings got her bored quickly.

Since we got some RaspberryPis to spare I gave it a try and created a small script which when the Pi gets powered on automatically copies all contents of the attached SD card to the houses storage server. Easy as Pi(e) – so to speak.

IMG_2322

So this is now an automated process for a couple of weeks – she comes home, get’s all batteries to their chargers, drops the sd cards into the reader and poweres on the Pi. After it copied everything successfully the Pi sends an eMail with a summary report of what has been done. So far so good – everything is on our backuped storage server then.

Now the problem was that she often does not immediately starts working on the pictures. But she wants to take a closer look without the need to sit in front of a big monitor – like taking a look at her iPad in the kitchen while drinking coffee.

So what we need was a tool that does this:

  • take a folder (the automated import folder) and get all images in there, order them by day
  • display an overview per day of all pictures taken
  • allow to see the fullsized picture if necessary
  • work on any mobile or stationary device in the household – preferably html5 responsive design gallery
  • it should be fast because commonly over 200 pictures are done per day
  • it should be opensource because – well opensource is great – and probably we would need to tweak things a bit

Since I did not find anything near what we had in mind I sat down this afternoon and wrote a tool myself. It’s opensourced and available for you to play with it. Here’s a short description what it does:

It’s called GalleryServer and basically is an embedded http server which takes all .jpg files from a folder (configurable) and offers you some handy tool urls which respons with JSON data for you to work with. I’ve written a very small html user interface with a bit of javascript (using the great html5 kickstart) that allows you to see all available days and get a nice thumbnail overview of each day – when you click on it it opens the full-size image in a new window.

It’s pretty fast because it’s not actively resizing the images – instead it’s taking the thumbnail picture from the original jpg file which the camera placed there during storing the picture. It’s got some caching and can be run on any operating system where mono / .net is available – which is probably anything – even the RaspberryPi.

Source 1: my wifes page
Source 2: 99lime html5 kickstart boilerplate
Source 3: https://github.com/bietiekay/GalleryServer

a good source of all things javascript libraries

Choosing the right javascript library is one of the key elements to create a good prototype in very short times – productive applications even. If you want to get new impressions, hints and links to those javascript libraries that will render your next project a success look no further:

Bildschirmfoto 2013-02-02 um 20.50.49

Source 1: http://pinterest.com/0x0/webdev/

What happened to: realtime Radiosity lighting

Back in 2006 I wrote about a new technology which the also new company Geomerics was demoeing.

Back in 2006 everything was just a demo. Now it seems that Geomerics found some very well known customers and without noticing a lot of the current generation games graphics beauty comes from the capabilities real time radiosity lighting is adding to the graphics.

“Geomerics delivers cutting-edge graphics technology to customers in the games and entertainment industries. Geomerics’ Enlighten technology is behind the lighting in best-selling titles including Battlefield 3, Need for Speed: The Run, Eve Online and Quantum Conundrum. Enlighten has been licensed by many of the top developers in the industry, including EA DICE, EA Bioware, THQ, Take 2 and Square Enix.” (Source)

There even is a more updated version of the demo video:

Source 1: real time radiosity lighting article from 2006
Source 2: Geomerics Presentations
Source 3: More Geomerics Media

Realtime Video Effects: Time Remap

With todays processing power and the faults of current generation digital video cameras you can have a lot of fun – if you know how:

The above demonstrated effect is called Time Remapping. The description of the video tells us more about the effect itself:

The effect was discovered accidentally by a photographer called Jacques Henri Lartigues at the beginning of the 20th century (in 1912 to be precise). He took a picture of a race car with eliptical deformed tires – an effect caused by the characteristics of the camera he was using.

Source 1: http://vimeo.com/7878518
Source 2: http://en.wikipedia.org/wiki/Jacques_Henri_Lartigue
Source 3: http://bokeh.fr/blog/photographes/la-voiture-deformee-de-jacques-henri-lartigue/

Sintel:

After the last Open Movie Project “Bug Buck Bunny” – Sintel is the next short movie available for free download. Get it here.

“Sintel” is an independently produced short film, initiated by the Blender Foundation as a means to further improve and validate the free/open source 3D creation suite Blender. With initial funding provided by 1000s of donations via the internet community, it has again proven to be a viable development model for both open 3D technology as for independent animation film.
This 15 minute film has been realized in the studio of the Amsterdam Blender Institute, by an international team of artists and developers. In addition to that, several crucial technical and creative targets have been realized online, by developers and artists and teams all over the world.

“Sintel” commenced in May 2009, with producer Ton Roosendaal establishing a core team consisting of Colin Levy (director), David Revoy (concept art), Martin Lodewijk (story) and Jan Morgenstern (composer). In August script writer Esther Wouda was approached as a consultant, which resulted in her taking the responsibility for the entire screenplay. Esther then worked in close cooperation with Colin, David and Ton to deliver the final script early November. Meanwhile, Colin and David realized the first storyboards.

Based on a public call for artists – with over 150 respondents – the Durian artist team got established in July 2009. They first met in a pre-production week in Amsterdam in August, and all decided to join the project per October 1st. With the final movie budget still unknown, the target then still was to finish the film within 7 months, with a team of 6 artists and 2 developers. At that time the team still had the hopes to be able to realize the script in a 6-8 minute film.

In november, the Netherlands Film Fund approved on a substantial subsidy for Sintel, enough to extend the project to 10 months, with possible 1 or 2 extra artist seats in the final months. It was also by this time that breakdowns and animatic edits showed that the script had to be revised to become more compact, with a story structure using a flashback.

In the months after, Colin’s work on the Director’s Layout – 3D animatic shots – and final designs on the grand finale gradually made the movie longer, from 9 minutes in november, to almost 12 in May. Proper story telling, to absorb an audience with convincing characters and action just takes time!

With the highly anticipated extra funding from the Amsterdam Cinegrid – also funding a 4k resolution version – Ton finally could extend the team with 5 artists and a developer in March 2010. With 14 people the film then was completed for a first screening on July 18th in cinema Studio K in Amsterdam.
Three artists then stayed in Amsterdam working on final shot edits, lighting design, compositing, and on the impressive 2 minute film credits. The movie ended up with a total duration of 14m:48s, 888 seconds!

Watch it now:

Sintel

Source 1: Elephants Dream
Source 2: Big Buck Bunny 
Source 3: Sintel
Source 3: Sintel Download

visualize your source control

There’s a great tool available to create impressive visualizations of source code repositories:

“Software projects are displayed by Gource as an animated tree with the root directory of the project at its centre. Directories appear as branches with files as leaves. Developers can be seen working on the tree at the times they contributed to the project.

Currently there is first party support for Git, Mercurial and Bazaar, and third party (using additional steps) for CVS and SVN. “


Source: http://code.google.com/p/gource/

Developing on a Microsoft Surface Table

At sones I am involved in a project that works with a piece of hardware I wanted to work with for about 3 years now: the Microsoft Surface Table.

I was able to play with some tables every now and then but I never had a “business case” which contained a Surface. Now that case just came to us: sones is at the CeBIT fair this year – we were invited by Microsoft Germany to join them and present our cool technology along with theirs.

Since we already had a graph visualisation tool the idea was to bring that tool to Surface and use the platform specific touch controls and gestures.

surface_visualgraph
the VisualGraph application that gave the initial idea

The good news was that it’s easier than thought to develop an application for Surface and all parties are highly committed to the project. The bad news is that we were short on time right from the start: less than 10 days from concept to live presentation isn’t the definition of “comfortable time schedule”. And since we’re currently in the process of development it’s a continueing race.

Thankfully Microsoft is committed to a degree they even made it possible to have two great Surface and WPF ninjas who enable is to get up to speed with the project (thanks to Frank Fischer, Andrea Kohlbauer-Hug, Rainer Nasch and Denis Bauer, you guys rock!).

surface_simulator
a Surface simulator

I was able to convice UID to jump in and contribute their designing and user interface knowledge to our little project (thanks to Franz Koller and Cristian Acevedo).

During the process of development I made some pictures which will be used here and there promoting the demonstration. To give you an idea of the progress we made here’s a before and after picture:

Surface_Finger2
We started with a simple port of VisualGraph to the surface table…

Surface_Finger
…and had something better working and looking at the end of that day.

I think everyone did a great job so far and will continue to do so – a lot work to be done till CeBIT! :-)

Source 1: http://www.sones.com
Source 2: http://www.microsoft.de
Source 3: http://www.uid.com/

draw Sequence Diagrams by writing them on a website

Since we are developers we do need tools to note and draw what we think would solve the problems of this planet.

One way to draw a sequence of actions would be a sequence diagram. There are a nbumber of tools to draw them but now I came across a web service that would allow me to write my sequence diagram in a easy textual representation and then it draws the diagram for me. Great stuff!

webseqdiagram

Source 1: http://en.wikipedia.org/wiki/Sequence_diagram
Source 2: http://websequencediagrams.com/

So what exactly is Microsoft Research doing?

I am proud to anounce that there’s a video publicly available which shows parts and projects Microsoft Research is working on currently. It’s great to see theses projects, concepts and ideas become publicly available one by one:

“Craig Mundie, chief research and strategy officer of Microsoft, presents “Rethinking Computing,” a look a how software and information technology can help solve the most pressing global challenges we face today. Part of UW’s Computer Science and Engineering’s Distinguished Lecture Series, Mundie demonstrates a number of current and future-looking technologies that show how computer science is changing scientific exploration and discovery in exciting ways. He discusses the role of new science in solving the global energy crisis, and answer questions from the audience.”

uwtv

Source: http://www.uwtv.org/programs/displayevent.aspx?rID=30363&fID=6021

If you ever needed Box-Shots of your product for a presentation…

If you – like us – need a picture of a shiny product box of a soon-to-be-released product for your presentation you may want to consider buying several tools to create such shots. But you can also just use a small tool and Windows Presentation Foundation.

There’s a great article on CodeProject where a almost everything is pre-set-up for our needs. And everything is written in C# – great stuff!

In action it looks like this:

sones-boxshot

Source: http://www.codeproject.com/KB/WPF/BoxShot.aspx?display=Print

Useful tools: OnTopReplica

Normally I am using a notebook and a 24” Widescreen TFT as a Dual-Monitor solution. In fact I am mostly using the 24” TFT for work and the notebook 14” TFT for all the things that don’t need to be in focus right now like Instant Messengers.

Now in those few cases when a video needs to be played I want it on the main monitor but I want it to take as little of space as possible. And I want it On Top of everything else… maybe sometimes I even want to control it’s opacity a bit…

Now there’s this cool tool called “OnTopReplica” – It’s available for free on Codeplex and works out of the box without installation.

After you start it you’ll end with a small glas window where you can right-click to get a menu. You choose a Window which needs to be replaces – for example the YouTube Browser Window. After that you can even control which region of this Window should be displayed. You can resize, move and of course control the opacity of this window.

ontopreplica 

It’s also great for presentations because it allows you to simply resize any window you like. It will resize it and while it does that the window always is “live” – so everything you’re doing in the original window will be displayed in the replica.

ontopreplica2 

Source: http://ontopreplica.codeplex.com/