brain simulators

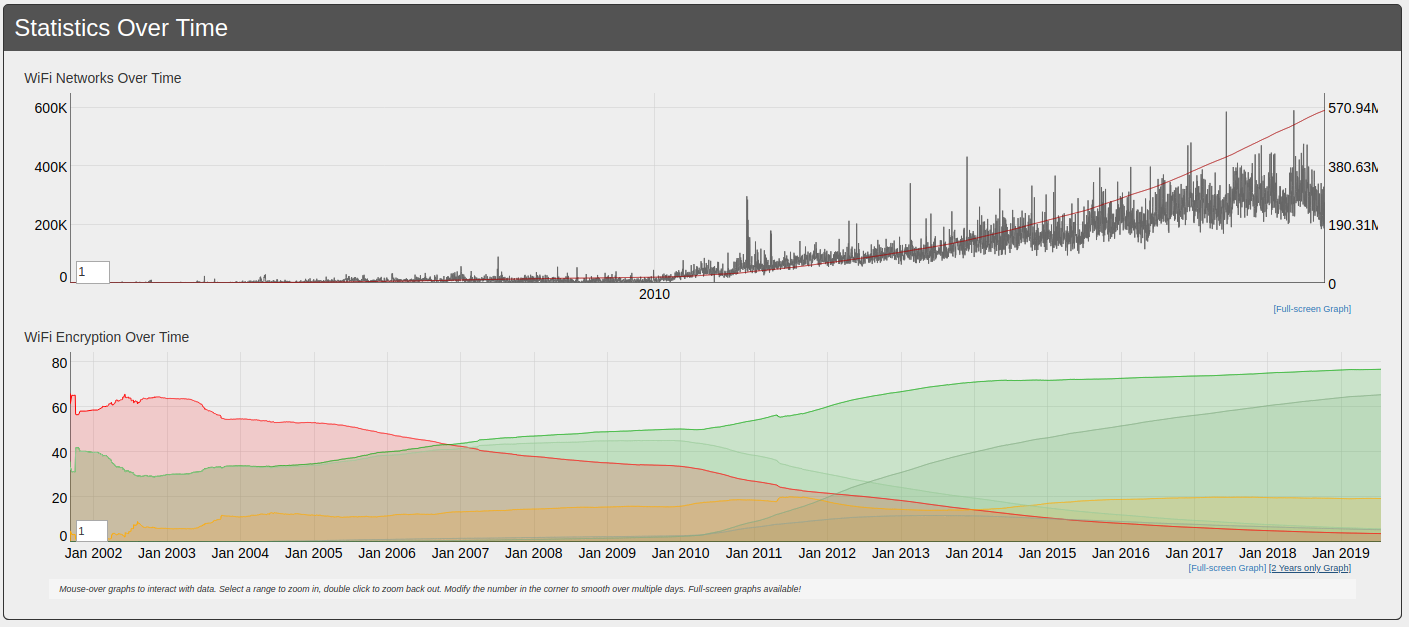
With recent announcements around human brain and brain-machine interface research like Neuralink the topic is seemingly seeing some more investments now.

As this whole topic is special to my heart I am interested in all things brain simulations. Thus here’s my personal “logbook entry” on the re-appearance of this topic:

This leads to one of the arguments for whole-brain simulation: it’ll help us solve the “biological imitation game,” a Turing test-like assay that pits digitally reconstructed brains against real ones. Iterations of the test help select increasingly more accurate models for a given task, which eventually become the most promising ideas for how specific biological networks operate. And because these models are based on mathematical equations, they could become the heart of next-generation AI.

Singularity Hub

There’s also a paper! – Unfortunately I cannot link directly to the paper as it is behind paywalls. Neuralink on the other side was so kind to publish open-access:

The Fastest journey from Roma to Londinium..

…in July takes 27.1 days, covering 2967 kilometers. At least if you would have taken the challenge in times of the Roman Empire.

ORBIS: The Stanford Geospatial Network Model of the Roman World reconstructs the time cost and financial expense associated with a wide range of different types of travel in antiquity. The model is based on a simplified version of the giant network of cities, roads, rivers and sea lanes that framed movement across the Roman Empire. It broadly reflects conditions around 200 CE but also covers a few sites and roads created in late antiquity.

ORBIS: The Stanford Geospatial Network Model of the Roman World

By simulating movement along the principal routes of the Roman road network, the main navigable rivers, and hundreds of sea routes in the Mediterranean, Black Sea and coastal Atlantic, this interactive model reconstructs the duration and financial cost of travel in antiquity.

Tool: Partition Recovery and Undelete – Testdisk

Mass storage hardware breaks all the time. Sometimes it’s hardware that breaks, but sometimes it’s the software that breaks. If it’s the software (or own talent) that made the data go boom, TestDisk is a tool you should know about.

DISCLAIMER: If the data you are trying so recover is actually worth anything you might want to reserve to a professional data recovery service rather than trying to train-on-the-job.

Apart from the availability of pre-compiled packages for most operating systems you can also grab a bootable LiveCD when everything seems gone and lost.

The process itself is rather exciting (if you want the data back) and may require a fresh pair of pants upfront, throughout and after.

Thankfully there’s a great wiki and documentation of how to go about the business of data recovery.

TestDisk is powerful free data recovery software! It was primarily designed to help recover lost partitions and/or make non-booting disks bootable again when these symptoms are caused by faulty software: certain types of viruses or human error (such as accidentally deleting a Partition Table). Partition table recovery using TestDisk is really easy.

  • TestDisk can
    • Fix partition table, recover deleted partition
    • Recover FAT32 boot sector from its backup
    • Rebuild FAT12/FAT16/FAT32 boot sector
    • Fix FAT tables
    • Rebuild NTFS boot sector
    • Recover NTFS boot sector from its backup
    • Fix MFT using MFT mirror
    • Locate ext2/ext3/ext4 Backup SuperBlock
    • Undelete files from FAT, exFAT, NTFS and ext2 filesystem
    • Copy files from deleted FAT, exFAT, NTFS and ext2/ext3/ext4 partitions.

TestDisk has features for both novices and experts. For those who know little or nothing about data recovery techniques, TestDisk can be used to collect detailed information about a non-booting drive which can then be sent to a tech for further analysis. Those more familiar with such procedures should find TestDisk a handy tool in performing onsite recovery.

And if you give up, think about writing an article of you actually digging deeper:

Wireless Network Mapping – data source and data sink

When you work with wireless networks and you do programming and mobile app development that works with things like user location you might find this useful.

Take thousands of users and you’ve got the worlds wifi networks mapped…

WiGGLE (Wireless Geographic Logging Engine) is a project which takes wireless network data + location and puts it into a big database. On top of storage it’s giving you access to that data.

We consolidate location and information of wireless networks world-wide to a central database, and have user-friendly desktop and web applications that can map, query and update the database via the web.

https://wigle.net/faq

So what’s my use-case? Apart from the obvious I will make use of this by finding out more about those fellow travelers around me. Many people probably to the same as me: Travel with a small wifi / 4g access point. Whenever this accesspoints shows up in scans the path will be traceable.

I am curious to see which access point around me is in the million-mile club yet…

full website screenshots from your commandline

Think of this: You want to capture a whole, multi-scroll-pages, web-page into one image.

This can be difficult without the right tools. It surely will be a lot of work to accomplish a 10th of thousand pixel height screenshot put together from multiple single screenshots…

CutyCapt is there to help! It’s a command line tool encapsulating the very powerful WebKit browser engine to render a full page and then create a single file screenshot of the whole page for you.

By example, this is what it did when told to screenshot this website:

PixelFed – Federated Image Sharing

In search of alternatives to the traditional centralized hosted social networks a lot of smart people have started to put time and thought into what is called “the-federation”.

The Federation refers to a global social network composed of nodes that talk to each other. Each of them is an installation of software which supports one of the federated social web protocols.

What is The Federation?

You may already have heard about projects like Mastodon, Diaspora*, Matrix (Synapse) and others.

The PixelFed project seems to gain some traction as apparently the first documentation and sources are made available.

PixelFed is a federated social image sharing platform, similar to instagram. Federation is done using the ActivityPub protocol, which is used by Mastodon, PeerTube, Pleroma, and more. Through ActivityPub PixelFed can share and interact with these platforms, as well as other instances of PixelFed.

the-federation

I am posting this here as to my personal logbook.

Given that there’s already a Dockerfile I will give it a try as soon as possible.

WiFi QR Code Generator

Whenever we arrive at a place that we have not been before it is important to get properly connected to the internet.

Finding wifi SSIDs and typing passwords is tedious and prone to errors. There is an easier way of course!

The owner of the wireless network can generate a QR code that you can easily take a photo of and your phone will automatically prompt you to log into the wireless network without you having to type anything.

On your phone it looks like this:

To generate these QR codes that contain all information for visitors/new users to connect this simple tool / online generator can be used:

Ever wanted to create a cool QR code for your guests? But never wanted to type in your WiFi credentials into a form that submits them to a remote webserver to render the QR code? QiFi for the rescue! It will render the code in your browser, on your machine, so the WiFi stays as secure as it was before (read the code if you do not trust text on the internet :-))!

Qifi.org

Don’t worry: your access point information is not transferred over the internet. As this is open source at the time of writing the data was held in HTML 5 local storage on the local browser only and not transferred out.

CCCamp 2019 – 21. – 25. August 2019

The Chaos Communication Camp is an international, five-day open-air event for hackers and associated life-forms. It provides a relaxed atmosphere for free exchange of technical, social, and political ideas. The Camp has everything you need: power, internet, food and fun. Bring your tent and participate!

CCCamp 2019 Wiki

It has been 2005 that I had the time and chance to attend an international open-air meeting of normal people. Of course I am talking about the 2005 What-the-hack I wrote about back then.

This year it’s time again for the Chaos Communication Camp in Germany. Sadly still I won’t be attending. Clearly that needs to change with one of the next iterations. With the CCC events becoming highly valuable also for families maybe it’s a chance in the future to meet up with old and valued friends (wink-wink Andreas Heil).

The Chaos Communication Camp (also known as CCCamp) is an international meeting of hackers that takes place every four years, organized by the Chaos Computer Club (CCC). So far all CCCamps have been held near Berlin, Germany.

The camp is an event for providing information about technical and societal issues, such as privacy, freedom of information and data security. Hosted speeches are held in big tents and conducted in English as well as German. Each participant may pitch a tent and connect to a fast internet connection and power.

CCCamp in Wikipedia

Enjoy the intro-movie that has just been made available to us, alongside the whole design material:

generate web-ready graphs and data visualizations without coding

Plot.ly is both a well known software library of impressive visualizations and a company providing software and know-how around visualizations.

With the libraries requiring a fair amount of know-how and programming to be useful to everyone there is now seemingly a multitude of tools that wraps the powers of the library and provides a great online-/web-browser experience to create impressive visualizations:

The access path to this quite powerful tool does somehow not be very easily found. So I am linking to it for your and my later reference.

electronic firecracker: Chuwi Hi10 AIR Tablet

The Android tablets I am using for my kitchen scale display and for myfitnesspal data-entry are aging quite bad and apart from the near-display death of one of the tablets both are not supported and updated anymore.

Using them therefore poses an increasing risk. After one of them almost died on me I was determined to replace them both. Looking at alternatives at the lowest possible price quickly showed that I am not going to get another Android tablet.

Instead I was ready to give a chinese company a chance:

I ordered it on 24th of June and it was delivered today. All in all I’ve paid 136 Euro for the tablet and 45 Euro for the keyboard attachement.

Despite the ridiculously low price this thing is quite impressive. It’s sporting a fast-enough Intel Atom processor with 1.4 ghz and 4 Gbyte of RAM. The 64 Gb of solid-state storage where quickly upgraded by an additional 400 Gb MicroSD card for local data storage.

As of writing this it’s still installing and updating the Windows 10 to 1903 but so far I am beyond impressed.

I’ll write more about the device when I’ve had more time to use it. One word for the keyboard attachement: the keyboard is good-enough. Not great but better than for example that on the Pinebook. The touchpad is very small but works – the thing has a Touchscreen anyway.

bridge the openvpn-status.log to MQTT

For big parts of my VPN needs I use OpenVPN. Especially on iOS devices the deep integration just works. Even to a degree that you enable the VPN once and the device will transparently keep it up / reestablish connections when required.

OpenVPN protocol has emerged to establish itself as a de- facto standard in the open source networking space with over 50 million downloads. OpenVPN is entirely a community-supported OSS project which uses the GPL license.

VISIT THE OPENVPN COMMUNITY

I am using the dockerized version of OpenVPN. From there I’ve got several ways to get telemetry data (like connections, traffic, …) out of it. One way is the management interface provided by OpenVPN. Another way is by using the default openvpn-status.log file.

Since the easiest way out-of-the-box was to use the logfile I sat down and wrote a little 2mqtt bridge for the contents of the logfile.

It’s also dockerized so you can easily set it up by pointing the openvpn-status.log to the right volume/mount-point.

When done it’ll produce MQTT messages like this:

The set-up and start-up is rather simple:

docker run -d --restart=always --volume /openvpnstatus2mqttconfiglocation/:/configuration --volume /openvpnstatusloglocation/:/openvpn openvpn-status2mqtt

MQTT Broker, Topic-Prefix and so on are configured with the .json configuration file found along the project.

Of course everything I wrote is available on GitHub as open-source.

The immediate outcome of this is that with the always-on VPN I am now getting statistics about, for example, the data consumption of my iPhone.

The big traffic spike at 1 AM is the backup that my iPhone does every night. Very interesting also how often the connection is closed and opened again even without me using the phone…

I don’t like the long-tail Windows 10 default cursor

The first device in my household recently has updated itself to the newest Windows 10 1903 build.

On the very first moment of the login screen appearing and logging in I could tell that I hate one specific change that has made it into this latest update.

And it’s the default mouse cursor.

Back in the Pre-Windows Vista days, when I used to work for Microsoft, I was using the latest internal build of Windows and just around the first RTM (release-to-manufacture) build they touched up on the final designs.

I remember vividly when the mouse cursor had changed from the one we new and used since Windows 3 to a shorter tailed more “high-def” looking one.

Since then there were a couple of changes on the cursor but the general design was kept.

Now apparently with the latest Windows 10 update from 1803 to 1903 I got a new – old default mouse cursor.

left: like!
right: booh!

By reflex I changed it back to the one I love and stored safely in a backup. I cannot stand the long tail and the weird pixel-ness of the cursor. It just looks kinda weird to my eyes.

the “new” cursor in 1903
the beloved cursor.

Which one do you like better?

terminates the calling process if buffer is not a valid userspace pointer.

How to build security into your software? It’s always simple to find examples where things gone wrong. Where security was compromised and things did not work out as the software authors envisioned.

As always there are new concepts and operating systems being implemented.

A particularly interesting example of security software design can be observed here:

Fuchsia is an open source capability-based operating system currently being developed by Google.

In contrast to prior Google-developed operating systems such as Chrome OS and Android, which are based on the Linux kernel, Fuchsia is based on a new microkernel called Zircon. The name Zircon refers to the mineral of the same name.

Google Fuchsia

So you now know what Fuchsia is. Now on to the actual example. For this we have to take a look into the developer documentation of Zircon:

So this describes a method to get random numbers from the systems cryptocraphically-secure-random-number-generator (CPRNG). It takes a pointer to a memory location as a parameter.

Now. What’s secure about that? It’s the behaviour of the method when it is encountering an unsecure situation:

It’ll kill the calling process when the pointer is not valid.

a red triangle on the window

When you walk around in Tokyo you will find that many buildings have red-triangle markings on some of the windows / panels on the outside.

some of the windows have red triangles pointing down
do you see the triangles pointing down on the upper right wall?

I noticed them as well but I could not think of an explanation. Digging for information brought up this:

Panels to fire access openings shall be indicated with either a red or orange triangle of equal sides (minimum 150mm on each side), which can be upright or inverted, on the external side of the wall and with the wordings “Firefighting Access – Do Not Obstruct” of at least 25mm height on the internal side.

Singapore Firefighting Guide 2018

The red triangles on the buildings/hotel windows in Japan are the rescue paths to be used in case of fire. All fire fighters know the meaning of this red triangle on the windows. Red in color makes it prominent, to be located easily by the fire fighters in case of a fire incident. During a fire incident, windows are generally broken to allow for smoke and other gases to come out of the building.

Triangles in Japan

what do you do with a rental car?

“The only thing we can say is that data show a number of people rent cars without driving them.”

Growing number of car-sharing users don’t rent cars for driving

Wait. What?

“Usually the only place I can take a nap while visiting my clients is a cybercafe in front of the station, but renting a car to sleep in is just a few hundred yen (several dollars), almost the same as staying in the cybercafe.”

Growing number of car-sharing users don’t rent cars for driving

Right…

automated downloads

Hmm… I’ve set-up a script to automatically download a TV show about a year ago and just remembered it…

Apparently 1 year of this show is 167 Gbyte…

For completeness the download script – ignore my bad scripting:

#!/bin/bash

# parameter 1: month
# parameter 2: from day
# parameter 3: to day
# parameter 4: year

# data -dmonday +%d

next_monday=$(date -dmonday +%d)
next_monday_month=$(date -dmonday +%m)
next_monday_year=$(date -dmonday +%y)

previous_monday=$(date -d'monday-7 days' +%d)
previous_monday_month=$(date -d'monday-7 days' +%m)
previous_monday_year=$(date -d'monday-7 days' +%y)

next_friday=$(date -dfriday +%d)
next_friday_month=$(date -dfriday +%m)
next_friday_year=$(date -dfriday +%y)

previous_friday=$(date -d'friday-7 days' +%d)
previous_friday_month=$(date -d'friday-7 days' +%m)
previous_friday_year=$(date -d'friday-7 days' +%y)

for i in `seq 1 7`;
do
        day=$(date -d'today+'$i' days' +%d)
        month=$(date -d'today+'$i' days' +%m)
        year=$(date -d'today+'$i' days' +%y)
        wget -c "https://rodlzdf-a.akamaihd.net/none/zdf/"$year"/"$month"/"$year$month$day"_sendung_dku/1/"$year$month$day"_sendung_dku_3328k_p36v14.mp4"
done

IP-over-DNS

Picture yourself in this situation. You connect to a network and nothing works. Except for this:

It is quite common to have DNS working in networks while everything else is not. Sometimes the network requires a log-in to give you access to a small portion of the internet.

Now, with the help of a tool called iodine, you can get access to the full internet with only DNS working in your current network:

iodine lets you tunnel IPv4 data through a DNS server. This can be usable in different situations where internet access is firewalled, but DNS queries are allowed. 

It runs on Linux, Mac OS X, FreeBSD, NetBSD, OpenBSD and Windows and needs a TUN/TAP device. The bandwidth is asymmetrical with limited upstream and up to 1 Mbit/s downstream. 

iodine

Setting it up is a bit of work but given that you are anyway having access to a well connected server on the free portion of the internet it can be easily done.

Of course the source is on github.

making ICs at home

Try to wrap your head around this: There are people out there that take the term “Maker” to new levels. People Like Sam Zeloof. He went out and created his very own integrated circuit designs and then he built them. Like the actual silicon, the die, the bonded chip, the IC. The real thing.

Be inspired:

I am very excited to announce the details of my first integrated circuit and share the journey that this project has taken me on over the past year. I hope that my success will inspire others and help start a revolution in home chip fabrication. When I set out on this project I had no idea of what I had gotten myself into, but in the end I learned more than I ever thought I would about physics, chemistry, optics, electronics, and so many other fields. Furthermore, my efforts have only been matched with the most positive feedback and support from the world; I owe a sincere thanks to everyone who has helped me, given me advice, and inspired me on this project. Especially my amazing parents, who not only support and encourage me in any way they can but also give me a space to work in and put up with the electricity costs… Thank you!

Sam Zeloof

Decoding history, the hard way (and with machine learning)

Imagine you’ve got this ancient piece of technology in front of you. You clearly understand how the hardware works and you are even able to emulate the hardware on your modern-world computer.

Unfortunately hardware is only one half of the story. Software is the other half. And software at this time of the past was burned into chips which do not easily give their secret software away.

But let’s start with the hardware:

The IBM 5100 Portable Computer is a portable computer (one of the first) introduced in September 1975, six years before the IBM Personal Computer. It was the evolution of a prototype called the SCAMP (Special Computer APL Machine Portable) that was developed at the IBM Palo Alto Scientific Center in 1973. In January 1978, IBM announced the IBM 5110, its larger cousin, and in February 1980 IBM announced the IBM 5120. The 5100 was withdrawn in March 1982.

When the IBM PC was introduced in 1981, it was originally designated as the IBM 5150, putting it in the “5100” series, though its architecture was not directly descended from the IBM 5100.

And now on to the software:

The IBM 5100 portable computer came with some of its built-in programs stored in a read-only memory called the “non-executable ROS”. (ROS = “read-only storage”.) In contrast with the “executable ROS”, which supplies instructions to the 5100’s processor directly, the non-executable ROS is accessed using sequential I/O operations, a bit like a tape.

Most notably, the non-executable ROS holds the interactive interpreters for the APL and BASIC programming languages. These are not “native” 5100 programs but were expressed instead in System/370 mainframe and System/3 minicomputer machine code respectively. The 5100 runs emulator programs for those computers in order to host the interpreters, so perhaps it’s just as well that the non-executable ROS is non-executable.

DATA

So this write-up is all about how the bits where pushed to the screen and recorded as pictures of the said screen. The characters in these pictures then where analyzed and with the help of machine learning the data could be successfully extracted. It is mind-boggling. And it is all on Github.

グランツリー武蔵小杉 and Park City Forest Towers on canvas

I’ve blogged about those pictures taken day- and night-time before. I’ve also blogged about how they where produced.

With a picture spot freed at one of the walls in our house we decided to print the day and night pictures on canvas and have them side-by-side. And it looks great, I think.

I might want to take the night picture again with the slightly different perspective
close up on the canvas structure

Bitmap & tilemap generation with the help of ideas from quantum mechanics

You can get a grasp at the beautiful side of science with visualizations and algorithms that output visual results.

This is the example of producing lots and lots of complex data (houses!) from a small set of input data. It is widely used in game development but also can be helpful to generate parameterized test and simulation environments for machine learning.

So before sending you over to the more detailed explanation the visual example:

This is a lot of different house images. Those are generated using a program called WaveFunctionCollapse:

WFC initializes output bitmap in a completely unobserved state, where each pixel value is in superposition of colors of the input bitmap (so if the input was black & white then the unobserved states are shown in different shades of grey). The coefficients in these superpositions are real numbers, not complex numbers, so it doesn’t do the actual quantum mechanics, but it was inspired by QM. Then the program goes into the observation-propagation cycle:

On each observation step an NxN region is chosen among the unobserved which has the lowest Shannon entropy. This region’s state then collapses into a definite state according to its coefficients and the distribution of NxN patterns in the input.

On each propagation step new information gained from the collapse on the previous step propagates through the output.

On each step the overall entropy decreases and in the end we have a completely observed state, the wave function has collapsed.

It may happen that during propagation all the coefficients for a certain pixel become zero. That means that the algorithm has run into a contradiction and can not continue. The problem of determining whether a certain bitmap allows other nontrivial bitmaps satisfying condition (C1) is NP-hard, so it’s impossible to create a fast solution that always finishes. In practice, however, the algorithm runs into contradictions surprisingly rarely.

Wave Function Collapse algorithm has been implemented in C++PythonKotlinRustJuliaGoHaxeJavaScript and adapted to Unity. You can download official executables from itch.io or run it in the browser. WFC generates levels in Bad NorthCaves of Qudseveral smaller games and many prototypes. It led to new research. For more related workexplanationsinteractive demosguidestutorials and examples see the ports, forks and spinoffs section.

useful CSS Grid Generator

This project is a way for people to use CSS Grid features quickly to create dynamic layouts.

You can set the numbers, and units of your columns and rows, and I’ll generate a CSS grid for you! Drag within the boxes to create divs placed within the grid.

I noticed a lot of people weren’t using Grid because they felt it was too complicated and they couldn’t understand it. Grid is capable of so much, and this small generator only touches on a fraction of the features. The purpose of this is so people get up and running quickly, and create more interesting layouts.

Once you work with this a bit, I suggest checking out resources by Rachel AndrewJen Simmons, and Dave Geddes to dive deeper. There is also a CSS Grid Guide on CSS-Tricks, and a fun little game called Grid Garden to help you learn more!

Source

Celebrate Mid Year’s Day

The middle day of the year. Use only middle names, stay to the middle of the road, pat or rub your or someone else’s middle (this is a great day to apply to join The Order of the Holy Chao Belly Rubbers). Point to things with your middle finger. Visit a middle school and talk about the good old days of the Middle Ages. (If you want to get technical, on Leap Year this day would run from noon of July 2 to noon of July 3, but you don’t have to get that anal unless you really want to).

Mid Year’s Day

online celebrities: Elon Musk

Seemingly short-message services are becoming the standard mode of communication for the powerful and rich. It seems that especially Twitter is capable of bringing the worst in those among us to the outside.

Of course the most controversial statements are being washed away by the sheer throughput. The next one always comes up quicker than you expect.

Helping the masses to keep track is a main task of journalism. That being said traditional journalism (as in newspapers, television) sees great difficulties to keep track as well. Too much, too quick.

So new forms of journalism develop. Often more tendentious then helpful for the cause so they require the cautious mind of the reader to add some more perspective.

This is the example of such a newly developing “tracking journalism” site around the dazzling public character that is Elon Musk. It is called “elonmusk.today“.

Editor’s note: others have done great work exposing Musk’s shameless charlatan carnival barking. If you enjoy this sort of thing, I highly recommend Niya White’s excellent article Musk Misses: The Stories You Don’t Hear About Tesla Anymore …